Intraday trading around 70% accurate signals for Amibroker (AFL)
knb1978 over 13 years ago Amibroker (AFL)
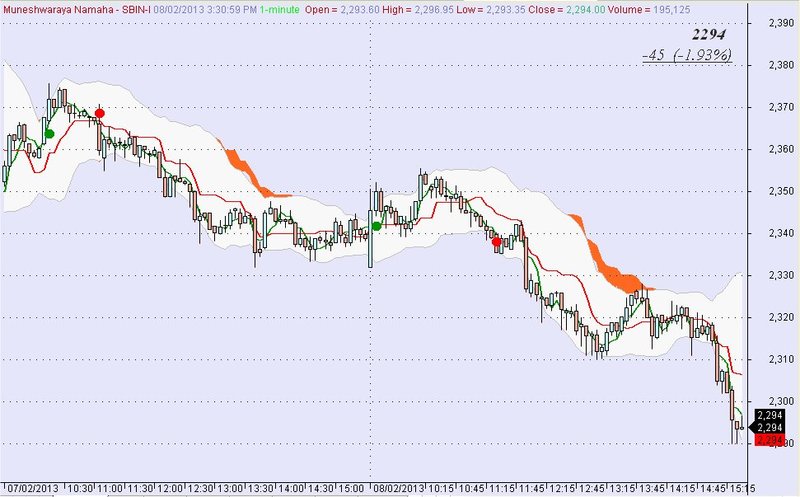
It’s a Simple Intraday system. Even new comers can use it as it shows buy-sell signals. Just follow the signals and trade accordingly. And at eom you’ll be on the positive side with good profits. Try it once…
Screenshots
Indicator / Formula
Copy & Paste Friendly
_SECTION_BEGIN("Price");
SetChartOptions(0,chartShowArrows|chartShowDates);
_N(Title = StrFormat("{{NAME}} - {{INTERVAL}} {{DATE}} Open %g, Hi %g, Lo %g, Close %g (%.1f%%) {{VALUES}}", O, H, L, C, SelectedValue( ROC( C, 1 ) ) ));
Plot( C, "Close", ParamColor("Color", colorBlack ), styleNoTitle | ParamStyle("Style") | GetPriceStyle() );
_SECTION_END();

_SECTION_BEGIN("Bollinger Bands");
P = ParamField("Price field",-1);
Periods = Param("Periods", 15, 2, 100, 1 );
Width = Param("Width", 2, 0, 10, 0.05 );
Color = ParamColor("Color", colorLightGrey );
Style = ParamStyle("Style", styleLine | styleNoLabel ) | styleNoLabel;
Plot( bbt = BBandTop( P, Periods, Width ), "BBTop" + _PARAM_VALUES(), Color, Style );
Plot( bbb = BBandBot( P, Periods, Width ), "BBBot" + _PARAM_VALUES(), Color, Style );
PlotOHLC( bbt, bbt, bbb, bbb, "", ColorBlend( Color, colorWhite, 0.9 ), styleNoLabel | styleCloud | styleNoRescale, Null, Null, Null, -1 );
_SECTION_END();

_SECTION_BEGIN("Ichimoku");
prds = Param( "Standard Line Periods", 13, 5, 26, 1 );
turn = Param( "Turning Line Periods", 3, 3, 10, 1 );
delay = Param( "Delayed Line Periods", 12, 4, 25, 1 );
span = Param( "Spans Periods", 16, 10, 52, 1 );

TL = ( HHV( H, turn ) + LLV( L, turn ) ) / 2;
SL = ( HHV( H, prds ) + LLV( L, prds ) ) / 2;
DL = Ref( C, delay );
Sp1 = ( SL + TL ) / 2;
Sp2 = ( HHV( H, span ) + LLV( L, span ) ) / 2;

_N( Title = StrFormat( "{{NAME}} - {{INTERVAL}} {{DATE}} Open %g, Hi %g, Lo %g, Close %g (%.1f%%) Vol " + WriteVal( V, 1.0 ) + " {{VALUES}}", O, H, L, C, SelectedValue( ROC( C, 1 ) ) ) );

Plot( C, "Close", colorBlack, styleNoTitle | GetPriceStyle() );
Plot( SL, "SL", colorRed, styleThick | styleNoLabel );
Plot( TL, "TL", colorGreen, styleThick | styleNoLabel );
color = IIf( Sp1 > Sp2, ParamColor( "Span1 Color", ColorRGB( 0, 255, 0 ) ), ParamColor( "Span2 Color", ColorRGB( 255, 104, 32 ) ) );
PlotOHLC ( Sp1, Sp1, Sp2, Sp2, "Cloud", Color, styleCloud | styleNoLabel, Null, Null, delay, -2 );
_SECTION_END();


//Magfied Market Price
GfxSetTextAlign( 6 );// left alignment
FS=Param("Font Size",15,11,100,1);
GfxSelectFont("Times New Roman", FS, 700, True );
GfxSetBkMode(0); // transparent
GfxSetTextColor( ColorHSB( 42, 42, 42 ) );
Hor=Param("Horizonta Position",860,1,1200,1);
Ver=Param("Vertica Position",27,1,830,1);
GfxTextOut(""+C, Hor , Ver );
YC=TimeFrameGetPrice("C",inDaily,-1);
DD=Prec(C-YC,2);
xx=Prec((DD/YC)*100,2);
FS2=Param("Font Size2",15,11,100,1);
GfxSelectFont("Times New Roman", FS2,11, 700, True );
GfxSetBkMode( colorGreen );
Hor1=Param("Horizontal Position",835,1,1200,1);
Ver1=Param("Vertical Position",7,1,830,1);
GfxSetTextColor( ColorHSB( 42, 42, 42 ) );
GfxTextOut(""+DD+"  ("+xx+"%)", Hor1 , Ver1+45 );

dec = (Param("Decimals",2,0,7,1)/10)+1;

Title =EncodeColor(255)+ "Muneshwaraya Namaha" + " - " + Name() + " " + EncodeColor(30) + Date() +
" " + EncodeColor(5) + "{{INTERVAL}} " +
EncodeColor(255)+ " Open = "+ EncodeColor(30)+ WriteVal(O,dec) +
EncodeColor(255)+ " High = "+ EncodeColor(30)+ WriteVal(H,dec) +
EncodeColor(255)+ " Low = "+ EncodeColor(30)+ WriteVal(L,dec) +
EncodeColor(255)+ " Close = "+ EncodeColor(35)+ WriteVal(C,dec)+
EncodeColor(255)+ " Volume = "+ EncodeColor(30)+ WriteVal(V,1) ;

_SECTION_BEGIN("Pivot Trading System");

// User defined parameters.

GraphXSpace = 10; //defines how much extra space should be added above and below graph line (in percent).

dist = 0.25*ATR(10);
Capital=Param("Total capital",100000,10000,1000000,1000);
drawdown=Param("Max. loss per trade as % of Capital", 1.0,0.5,25.0,0.1);
room=Param("Room for S/L as % of Pivot value",0.0015,0.0001,0.025,0.001);

PH= ValueWhen(
(Ref(H,-2) > Ref(H, -4)) AND
(Ref(H,-2) > Ref(H, -3)) AND
(Ref(H,-2) > Ref(H, -1)) AND
(Ref(H,-2) > H), Ref(H,-2));

PL= ValueWhen(
(Ref(L,-2) <= Ref(L, -4)) AND
(Ref(L,-2) <= Ref(L, -3)) AND
(Ref(L,-2) <= Ref(L, -1)) AND
(Ref(L,-2) <= L), Ref(L,-2));


phfilter=PH+(room*PH);
plfilter=PL-(room*PL);

for (a=4;a<BarCount;a++)
{
if ((H[a-2] >= H[a-4]) AND
(H[a-2] >= H[a-3]) AND
(H[a-2] >= H[a-1]) AND
(H[a-2] >= H[a]))
PlotText("", a-2, H[a-2], colorGreen);

if ((L[a-2] <= L[a-4]) AND
(L[a-2] <= L[a-3]) AND
(L[a-2] <= L[a-1]) AND
(L[a-2] <= L[a]))
PlotText("", a-2, L[a-2]-dist[a-2], colorRed);
}

//Condition for buy : Enter when Close crosses latest pivot high.
Buy = C> (PH+(room*PH));

initialStopBuy=Ref(PL,2)-(Ref(PL,2)*room/100);
trailStopBuy=IIf(C>PH,Ref(initialStopBuy,-1),initialStopBuy);

newStopBuy=trailStopBuy;

BuyLimitCapital=int(Capital/C);
SLbuy=round(C-initialStopBuy);
BuyLimitSL=int((Capital*drawdown)/(100*SLbuy));

//Condition for sell : Exit when previous pivot low is cracked.
Sell = C< (PL-(room*PL));

Buy = ExRem(Buy,Sell);
Sell= ExRem(Sell,Buy);

Short = Sell;
Cover = Buy;

Short=ExRem(Short,Cover);
Cover=ExRem(Cover,Short);


shape = Buy * shapeCircle + Sell * shapeCircle;
PlotShapes( shape, IIf( Buy, colorGreen, colorRed ),0, IIf( Buy, Low, High ) );

_SECTION_END();


_SECTION_BEGIN("Macd coloured price");
//============================================candle sticks=======================

a = Param("fast macd period",3,1,100,1);
b = Param("slow macd period",34,1,100,1);

Up_MACD_TRIX = MACD( a, b ) > Ref(MACD(a,b),-1);

Down_MACD_TRIX =  MACD( a, b ) < Ref(MACD(a,b),-1);

Colormacd = IIf(Up_MACD_TRIX,colorLime,IIf(Down_MACD_TRIX,colorRed,colorCustom12));


PlotOHLC( Open, High, Low, Close, "", Colormacd, styleBar );

_SECTION_END();


_SECTION_END();
7 comments
Leave Comment
Please login here to leave a comment.
Thanx you for the Indicator.. Impressive.
Morgen,Thank you for this AFL
I am new comer I required more this type AFL
Please contact me email:nagartrilok@gmail.com
superb indicator, thanks for it and my 5 votes to it.
ln:15,Col:45:Error 31.Syntax error,execting’)’ or ‘,’
ln:36,Col:95:Error 16.Too many argumengts
Hi II98123,
Please try in ami 5.5 or above version. Its working fine for me…
Thanks for all others for encouraging me..
no buy/sell signals coming
nice indicator, works in commodities too