PIVOT HIGH-LOW AFL for Amibroker (AFL)
anandnst over 13 years ago Amibroker (AFL)
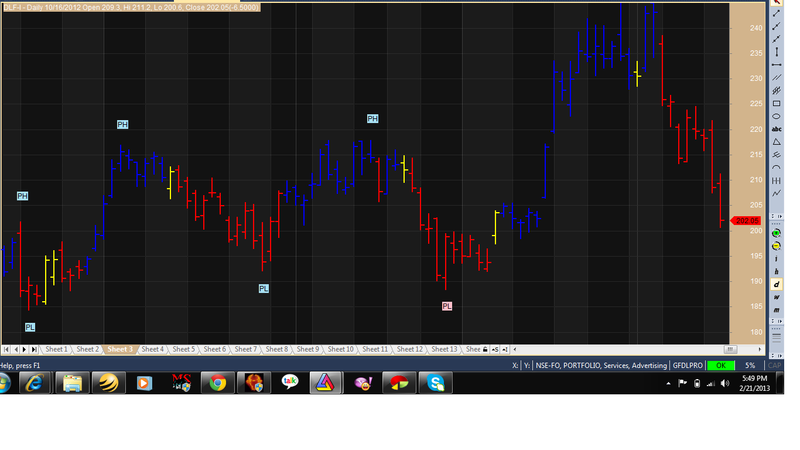
This indicator is useful in Daily, Weekly n Intraday charts to find top n bottoms.
Very useful for Investment as well Intraday trading.
(Plugin Required – download below link
www.mediafire.com/?znmwud2jdwt[/url] )
Copy paste JurikLib.dll and kpami.dll and
paste it in your Amibroker Plugin folder.
Or
Download Plugin from :-
http://wisestocktrader.com/indicators/174-the-foundation-by-southwind-v-13-00-int.
Screenshots
Indicator / Formula
Copy & Paste Friendly
_SECTION_BEGIN("Pivot High Pivot Low");


//user parameters
parmPlotScoreCard = ParamToggle("Plot KPScoreCard", "No|Yes", 1);
parmPlotA900AutoStop = ParamToggle("Plot A900/AutoStop", "No|Yes", 0);
parmA900Color = ParamColor("A900 Color", colorWhite);
parmA900Style = ParamStyle("A900 Style", styleLine, maskAll);
parmAutoStopColor = ParamColor("AutoStop Color", colorYellow);
parmAutoStopStyle = ParamStyle("AutoStop Style", styleLine, maskAll);
parmPPTextColor = ParamColor("PP Text color", colorBlack);
parmPPTrndColorUp = ParamColor("PP Trend Up color", ColorRGB(167,224,243) );
parmPPTrndColorDn = ParamColor("PP Trend Dwn color", ColorRGB(255,192,203) );
parmPPTextOffSet = Param("PP OffSet", 0.60, 0.40, 1.5, 0.1);
parmTickMultipler = Param("M/W tick allowance", 1, 0, 10, 1);
parmA900AutoStopX = ParamToggle("Plot A900/AutoStop Cross", "No|Yes");
parmA900AutoStopColorX = ParamColor("A900/AutoStop Cross Color", colorBlack);
ParmSCThreshold = Param("ScoreCard Threshold", 3, 1, 9, 1);
parmVoice = ParamToggle("Voice 123 Setups", "No|Yes", 0);
parmAlert = ParamToggle("Alert 123 Setups", "No|Yes", 0);
parmPivotPop = ParamToggle("PivotPop", "No|Yes", 1);
parmBarCancel = Param("Bar Cancel", 7, 1, 20, 1);
parmWaterLevelColor = ParamColor("WalterLevel Color", ColorRGB(127,255,212));
parmWaterLevelStyle = ParamStyle("WaterLevel Style", styleLine, maskAll);
parmBBPeriod = Param("Bollinger Band Period", 10, 2, 30, 1);
parmBBSD = Param("bollinger Band SD", 0.8, 0.2, 3.0);
ParmPlotPPIndicators = ParamToggle("Plot Pivot Pop indicators", "No|Yes", 0);
parmBBColor = ParamColor("BBands Color", colorBlack);
parmBBStyle = ParamStyle("BBands Style", styleLine, maskAll);

ParmDebug = ParamToggle("Debug", "No|Yes", 0);

// constants
_N(PaneName = Name() + Interval(2)+ _SECTION_NAME());
_N(NewBarName = "NewBar" + PaneName);

//functions
function NewBarP()
{
PrevDT = StaticVarGet( NewBarName);
DT = LastValue(DateTime());
StaticVarSet( NewBarName,DT);
return DT != PrevDT;
}
function MRoundP(Number, Multiple )
{
if(Multiple == 0 )
{

xMultiple = 0.01; }
else
{
xMultiple = Multiple;
}
Divided = Number / xMultiple;
intDivided = int(Divided);
intDivided = intDivided + round(Divided - intDivided);
return intDivided * xMultiple;
}

//miscellaneous setups
ObjAB = CreateObject("Broker.Application");
ticker = objAB.Stocks(Name() );
if(ticker.TickSize == 0)
{
TickValue = 0.01; //set TickValue to a penney
}
else
{
TickValue = ticker.TickSize; // use Tick Size for this symbol
}
NewBarSignal = NewBarP();
// KP Indicators
KPA900 = E_TSKPA900(Close);
KPAutoStop = E_TSKPAUTOSTOP(High,Low,Close);
Ctmpl = E_TSKPCOLORTMPL(Open,High,Low,Close,Volume); //ScoreCard
KPScoreCard = 0;
KPScoreCard = KPScoreCard + IIf(tskp_colortmplcnd0 > 0, 1, -1);
KPScoreCard = KPScoreCard + IIf(tskp_colortmplcnd1 > 0, 1, -1);
KPScoreCard = KPScoreCard + IIf(tskp_colortmplcnd2 > 0, 1, -1);
KPScoreCard = KPScoreCard + IIf(tskp_colortmplcnd3 > 0, 1, -1);
KPScoreCard = KPScoreCard + IIf(tskp_colortmplcnd4 > 0, 1, -1);
KPScoreCard = KPScoreCard + IIf(tskp_colortmplcnd5 > 0, 1, -1);
KPScoreCard = KPScoreCard + IIf(tskp_colortmplcnd6 > 0, 1, -1);
KPScoreCard = KPScoreCard + IIf(tskp_colortmplcnd7 > 0, 1, -1);
KPScoreCard = KPScoreCard + IIf(tskp_colortmplcnd8 > 0, 1, -1);

if(parmDebug == 1)
{
printf("a900: %0.6f% \nAutoStop: %0.6f%\nScoreCard: %0.0f%\n", KPA900, KPAutoStop, KPScoreCard);
}
if(parmPlotScoreCard == 1)
{
_N(Title = StrFormat("{{NAME}} - {{INTERVAL}} {{DATE}} Open %g, Hi %g, Lo %g, Close %g% (%0.4f%) {{VALUES}}", O, H, L, C, SelectedValue( C - Ref(C, -1)) ));
if( ParamToggle("Tooltip shows", "All Values|Only Prices" ) )
{
ToolTip=StrFormat("Open: %g\nHigh: %g\nLow: %g\nClose: %g (%.2f%%)\nVolume: "+NumToStr( V, 1 ), O, H, L, C, SelectedValue( ROC( C, 1 )));
}
Color = IIf(KPScoreCard >= parmSCThreshold, colorBlue, IIf(KPScoreCard <= -parmSCThreshold, colorRed, colorYellow) );
Plot( C, "Close", Color , styleNoTitle | ParamStyle("OHLC Style",styleBar | styleThick) | GetPriceStyle() );
}
//user want A900/AutoStop plotted
if(parmPlotA900AutoStop == 1)
{
Plot(KPA900, "A900", parmA900Color, parmA900Style);
Plot(KPAutoStop, "AutoStop", parmAutoStopColor, parmAutoStopStyle);
}
// find A900/AutoStop cross over/under with ScoreCard confirmation.
XOUp = (KPA900 > KPAutoStop) AND (KPScoreCard >= parmSCThreshold); // New Pivot Low
XODn = (KPA900 < KPAutoStop) AND (KPScoreCard <= -parmSCThreshold); // New Pivot High
if(parmDebug == 1)
{
printf(WriteIf(XOUp, "before= XOUp: True", "before= XOUp: False") + WriteIf(XODn, " XODn: True\n", " XODn: False\n") );
}
//remove duplicate signals
XOUp = ExRem(XOUp, XODn);
XODn = ExRem(XODn, XOUp);

if(parmDebug == 1)
{
printf(WriteIf(XOUp, "after= XOUp: True", "after= XOUp: False") + WriteIf(XODn, " XODn: True\n", " XODn: False\n") );
}
//find the current Pivot Points - PL and PH
//remember XOUp = 1 means a PL and XODn =1 means a PH
PLBars = IIf(XOUp, LowestSinceBars(XODn, L ,1), 0); //find the bar that produced the Lowest Low
PHBars = IIf(XODn, HighestSinceBars(XOUp, H, 1),0); //find the bar that produced the Highest High
//PLPrice = IIf(XOUp, Ref(L, -PLBars), 0);
//PHPrice = IIf(XODn, Ref(H, -PHBars),0);
PLPrice = Ref(L, -PLBars);
PHPrice = Ref(H, -PHBars);

//keep track of the previous Pivot Points
PrevPLBars = Ref(BarsSince(XOUp), -1) +1;
PrevPHBars = Ref(BarsSince(XODn), -1) +1;
PrevPLPrice = Ref(PLPrice, -prevPLBars);
PrevPHPrice = Ref(PHPrice, -PrevPHBars );
PivotsCloseEnough = TickValue * parmTickMultipler;
PLDifference = MroundP(PLPrice - PRevPLPrice, ticker.TickSize);
PHDifference = MroundP(PHPrice - PrevPHPrice, ticker.TickSize);
PPTrend = IIf(XOUp AND (PLDifference > PivotsCloseEnough) AND PrevPHPrice > PrevPLPrice AND PRevPHPrice > PLPrice, 1,
IIf(XOUp AND (PLDifference < - PivotsCloseEnough) AND PRevPHPrice > PrevPLPrice AND PrevPHPrice > PLPrice, -1,
IIf(XODn AND (PHDifference > PivotsCloseEnough) AND PrevPLPrice < PrevPHprice AND PrevPLPrice < PHPrice, 1,
IIf(XODn AND (PHDifference < -PivotsCloseEnough) AND PrevPLPrice < PrevPHPrice AND PrevPLPrice < PHPrice, -1,
IIf(XOUp AND (abs(PLDifference) <= PivotsCloseEnough) AND PrevPHPrice > PrevPLPrice AND PRevPHPrice > PLPrice, 2,
IIf(XODn AND (abs(PHDifference) <= PivotsCloseEnough) AND PrevPLPrice < PrevPHPrice AND PrevPLPrice < PHPrice, -2, 0)))) ));
if(ParmDebug)
{
printf("Current PH Bar: %g% /Price: %g%\n", PHBars, PHPrice);
printf("Current PL Bar: %g% /Price: %g%\n", PLBars, PLPrice);
printf("Previous PH Bar: %g% /Price: %g%\n", PrevPHBars, PrevPHPrice);
printf("Previous PL Bar: %g% /Price: %g%\n", PrevPLBars, PrevPLPrice) ;
printf("PP Trend: %g%\n", PPTrend);
printf("PHPrice - PrevPHPrice: %g%\nPLPrice - PrevPLPrice: %g%\nPivotsCloseEnough: %g%", PHDifference, PLDifference, PivotsCloseEnough);
}
//PLot pivots as text
dist = parmPPTextOffSet * ATR(10);
//for( i = 0; i < BarCount -1; i++)
for( i = 0; i < BarCount ; i++)
{
if(XOUp[i ] == 1 AND abs(PPTrend[i]) != 2) //cross up -plot the Pivot Low
{
PlotText("PL", i - PLBars[i], PLPrice[i] - dist[i] , parmPPTextColor, IIf(PPTrend[i] == 1, parmPPTrndColorUp, IIf(PPTrend[i] == -1, parmPPTrndColorDn, colorYellow) ));
}
if(XODn[i ] == 1 AND abs(PPTrend[i]) != 2) //cross down - plot the pivot high
{
PlotText("PH", i - PHBars[i], PHPrice[i] + dist[i], parmPPTextColor, IIf(PPTrend[i] == 1, parmPPTrndColorUp, IIf(PPTrend[i] == -1, parmPPTrndColorDn, colorYellow) ));
}
if(XOUp[i ] == 1 AND (PPTrend[i]) == 2) // the Pivot Low is a W Bottom
{
PlotText("PW", i - PLBars[i], PLPrice[i] - dist[i] , parmPPTextColor, colorYellow) ;
}
if(XODn[i ] == 1 AND PPTrend[i] == -2) //cross down - pivot high is a M Top
{
PlotText("PM", i - PHBars[i], PHPrice[i] + dist[i], parmPPTextColor, colorYellow) ;
}
} //end For
_SECTION_END();
24 comments
Leave Comment
Please login here to leave a comment.
Hello , Admin kindly approve the above formula.
i have posted it before 24 hours.
thanx you
I have these plugins installed but even then the afl, that needs them, doesn’t work! I wonder if these necessary plugins are suitable for Amibroker 5.60 64 bit. Do you need special plugins for a 64 bit Amibroker?
Hello Robhoot,
If you already have these plugins downloaded then you dont need to download it. Well its needed or else it would give errors after plotting the formula in ur system.
Regards
Thanks anandnst, but although I have installed those 2 plugins (juriklib.dll and kpami.dll) in my plugins-folder and T3_include.afl in my include-folder some afl’s, like “The Foundation”, give errors with my 64 bit Amibroker 5.60. So I was wondering what could be the problem….
Admin, Plz approve this AFL. I do not know how other guys copied it !!!
I don’t think they did. Approved. Sorry for delays.
As I said before I have all the necessary plugins installed and still get those nasty syntax errors. I have a 64 bit amibroker 5.60 but I thought that these plugins had to work properly in a 64 bit program. I hope somebody can give me a solution……
thanx for sharing…!
but
1. does this work on Ami 5.50? or it needs ami 5.60 as u r using.
2. i do have the required plugins but it is showing error in line 62. it says :
CreateObject is not multi threading friendly
plz solve my prob. if u could.
thanx in advance.
anyways……..
i got it running….
I also have the same error as ‘extremist’.
But High/Low Pivots we already have in KP SystemV1 or V2. Most important are Dynamic Support and Resistance lines in KwikPOP system. Better would be if somebody can write proper HPL and LPH signals. In formulas given by ‘ceurami’ S/R lines adjust when KP A900 crosses Autostop and the THIRD or even FOURTH candle (either blue or red) closes above/below Autostop. It should be when KP 900 crosses Autostop and the FIRST blue or red candle closes above/below Autostop. Then we could trade HPL or LPH when the signal appears.
S/R lines parameters can be adjusted either in the KwikPOP Black Box but we can’t do this or rewriting the formula somehow. I don’t know how do that. If somebody could that would be great!!
Hello anandnst sir, gud Thanks for sharing such a wonderful and usefull fomula from my side i give five star……
Thanx you Extremist n Kitika.
Well Buchaceck, this afl is not for u as u have everything whtever posted in wisestocktrader.
U told its already given in KP System v1 and V2 but everybody doesnt know coding to sepreate it from those Formula’s.
It is for all other people here in wisestocktrader who having less knowledge abt coding.You can Drag and drop this PHIGH-LOW AFL on any chart n enjoy your trading for Finding Tops n bottoms.
PIVOT HIGH SHOWS -(TEMPORARY HIGH OR TOP IN INTRADAY CHARTS)
PIVOT LOW SHOWS – (TEMPORARY LOW OR BOTTOM IN INTRADAY CHARTS)
SWING TRADING – USE HOURLY-DAILY CHARTS
MEDIUM TERM TRADING USE – DAILY + WEEKLY CHARTS
LONG TERM USE – WEEKLY + MONTHY CHARTS.
Thanx you
Regards
anandsnt- please, I didn’t mean any offense. Actually seeing letters is better then seeing dots. Your afl is useful for many people and that is good.
Note- I don’t have and use everything posted on this site. I have and use the KwikPOP system as given by ‘ceurami’ because according my opinion it is the best momentum trading system I have seen so far and TTM Squeeze enhanced with KwikPOP indicators. I have been using TTM Squeeze many years now. That is all. I also use Frank Dilernia’s Dynamic Timeframe channels – but that I have directly from him and I can’t post that system here since it is patented.
I apologize if you felt any offense. That was not what I meant. Any improvement in any afl. is always a great thing and if you can create Dynamic support and resistances with LPH and HPL the way it adjusts when KP A900 cross Autostop and the FIRST blue candle closes above Autostop or first RED candle closes below Autostop I would greatly appreciate it bacause I am not good at coding. The only indicator I still do wish for is a KP SnapBack from KwikPOP system – if you can provide that one you would hepl not only me but many and many others as well.
Regards
Hi hello Buchacek,
Well PH-PL is not clear by DOTS. Its better in letters. i have seen all videos of Kwikpop on youtube but lots of features are missing in KP V1 OR V2 as shown in videos. If you could put some light on it.. to use it successfully. i have been using too TTM Squeeze since long time. its effective in daily timeframe.
If you could share the above formula (Frank dilernia’s dynamic timeframe channels as u cant post it.. Mail me – Anandnst@Gmail.com.
I would try for your request n soon will come up with it too.
Sorry if my words hurt u in any sense.
Mail me the above formula – Anandnst@gmail.com
Thanx you
anandnst- better to go to www.kwikPOP.com and see all the training videos there.Not youtube. There is a whole system explained there and also 100 page manual.
As for Dilernia – I can’t do that. Google Frank Dilernia and contact him directly if you are interested. You would have to buy his book and study it to understand exactly what is going on there. I studied his two latest books. It is the best predictive system ever developed, better then Fibonacci and Elliot waves. And together with KwikPOP for exact entries nothing can beat that.I myself don’t use all the things in KP System 1 or 2. Just what is needed.
Thanks
Thanx anandnst, good work! Very useful, 5 stars for you!
Administrator, I wanted to give this genius 5 stars and I only can give him 4??
Thanx you Robhoot.
Hello Buchacek,
I will watch videos in Kwikpop.com.. No issue.
I have tried your Frank dilernia search.. i got the link (thetradertrading.blogspot.in)..
i want to ask.. it is the link where u bought the book n AFL? i will buy the books but meanwhile can u mail me your AFL to my mailing address – anandnst@gmail.com
I would be really thanxful.
Regards.
anandnst- if I send you all that is needed it will still be good for nothing because you have to study the book first and ask Frank any questions you might have to fully understand the concept behind it. He will answer any of your question by e-mail.
He wrote three or four books but if you read Market Trading Market Timing that is just enough. Don’t buy Trader Trading book as first mentioned book repeats the principles from the Trader Trading book. You need to comprehend the whole picture and structure of dynamic multi- timeframe channels and how they relate to each other. That can’t be done by seeing just afl. It is easy though to see what is going on. Just e-mail him and tell him you are interested in his system and he’ll tell you what to do.That e-book is not expensive and believe me you’ll be satisfied.He trades on Fibonacci Trader software hence he cannot provide you with any afl but he will give you the formula how to construct it. It’s extremely easy.That website you posted is his blog with daily re-cap. I don’t follow his blog as you have to subscribe to it and I think it is not need it. He will give you two weeks for free if you buy his book.
http://thetradingbook.blogspot.com.au/ – there is an e-mail somewhere on the right side. Click on it and it will show on the lower left bottom.
I have a question: in your afl above I am getting error : CreateObject is not multi threading friendly. It is running though but I don’t like if afl shows error. Is there any way you can fix this somehow?
Thanks
hello Buchacek,
Hope u doing well. I have visited the given URL. i have few Queries..
You have bought Printed version or PDF One?
How much pages the book is ??
Printed Version is 110 dollar
PDF is 75 dollar…
How printed version will be delieverd?
Hello anandnst- no that is the other book. The book you need to buy is the one above it and it is called Market Trading Market Timing and it cost $109. I bought the e-book or PDF and it has 291 pages.
The one you are referring to is Trader Trading book ( 218 pages). I have read that one as well and it is also great ( and explain things in detail) but as I said the first one cover the other too.
It is delivered to you by the e-mail. But why don’t you e-mail Frank and ask him directly? He is the author so he knows much more then me about it. But again I use KwikPOP for trading as it is in detail explained in www.KwikPOP.com. I use Dilernia for orientation where the market is and where it will most probably go. If you master KwikPOP you don’t need Dilernia and if you master Dilernia you don’t need KwikPOP. I combine both together. I use even KwikPOP indicators in Dilernia model just like I use KwikPOP indicators in TTM Squeeze but the different ones. It really needs years and years of studding and combining veriouse things together to come up with something you can trust and somrthing that can work. If somebody has a good idea or afl I still include it into my trading if I feel it is usefull. For example your afl is great but it is not how the KwikPOP is traded because they don’t trade PH and PL but HPL and LPH – that is different but again your afl was not meant to trade KwikPOP I guess but to identify bottoms and tops and that serves the purpose.Also I am not saying that what I use is the best. There are hundreds of ways to trade and it all depends on what you trust.
Regards
Warning 503 :CreateObject is not multi threading friendly.
how to solve pl
After Exploration, can we get pivot high/low values, and date corresponding to pivot? How? If it is already discussed in some other thread, kindly guide me to the topic(url)
Any upate to my query @ 23# ?