Pivots And Prices And Swing Volume for Amibroker (AFL)
esnataraj about 16 years ago Amibroker (AFL)
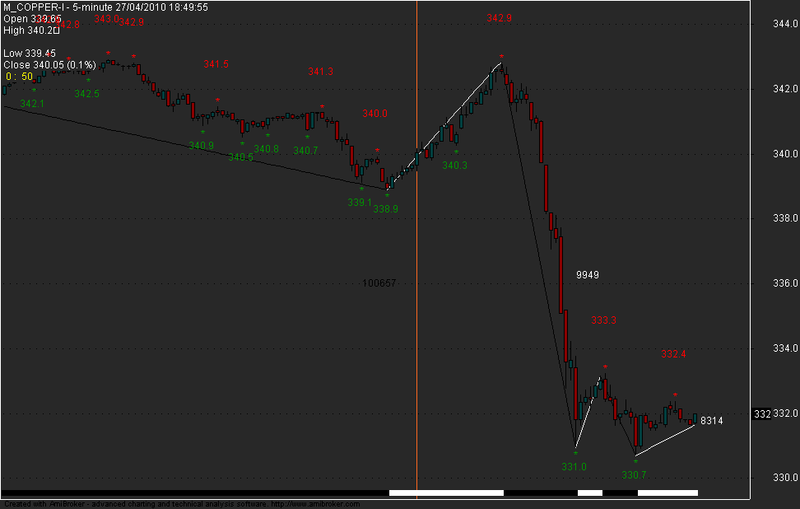
Cumulate the volume for each swing
by Reinsley
Following the S&C "Price+Volume=Price movement by Tom ORD S&C’s document which is stored in Yahoo! Group files and posted in user’s list
Mod of Pivots And Prices formula
Screenshots
Indicator / Formula
Copy & Paste Friendly
// Volume cum
//----------------------------------------------------------
// cumulate the volume for each swing

// by reinsley
// Following the S&C "Price+Volume=Price movement by Tom ORD
// S&C's document is stored in Yahoo! files
// Mod of the Pivots And Prices formula
//----------------------------------------------------------


_SECTION_BEGIN( "Price" );
_N( Title = StrFormat( "{{NAME}} - {{INTERVAL}} {{DATE}} \nOpen %g \nHigh %g
\nLow %g \nClose %g (%.1f%%) {{VALUES}}", O, H, L, C, SelectedValue( ROC( C, 1 )
) ) );
Plot( C, "", colorBlack , styleCandle );
_SECTION_END();

_SECTION_BEGIN( "pivot" );
price = ParamToggle( "Plot Price", "Off|On", 1 );
num = Param( "trend", 4, 1, 10, 1 );
dist = 0.5 * ATR( 10 );
rightfig = Param( "rightfig ", 7, 1, 10, 1 );
xspace = Param( "GraphXSpace ", 10, 1, 20, 1 );

mHHV = HHV( H, num );
mLLV = LLV( L, num );

FirstVisibleBar = Status( "FirstVisibleBar" );
Lastvisiblebar = Status( "LastVisibleBar" );

for ( b = Firstvisiblebar + num; b <= Lastvisiblebar AND b < BarCount - num;
b++ )
{
    i = num;
    ml = 0;
    mu = 0;

    while ( i > 0 )
    {

        if ( L[b] < L[b+i] )
        {
            ml++;
        }


        if ( H[b] > H[b+i] )
        {
            mu++;
        }

        i--;
    }


    if ( ml == num AND L[B] == mLLV[B] )
    {
        PlotText( "\n *\n", b, L[b], colorGreen );

        if ( price == 1 )
        {
            p = StrRight( NumToStr( L[b], 4.1 ), rightfig );
            PlotText( "\n\n" + p, b - 2 , L[b] , colorGreen );
        }
    }


    if ( mu == num AND H[B] == mHHV[B] )
    {
        PlotText( " *\n", b, H[b], colorRed );

        if ( price == 1 )
        {
            p = StrRight( NumToStr( H[b], 4.1 ), rightfig );
            PlotText( p , b - 2 , H[b] + dist[b] + 1, colorRed );
        }
    }
}

_SECTION_END();

// Vertical Daily Segment
segments = IIf( Interval() < inDaily, Day(), Month() );
segments = segments != Ref( segments , -1 );
Plot( segments, "", colorDarkBlue, styleHistogram | styleOwnScale | styleDashed
| styleNoLabel );

/*
Volbar = TimeFrameGetPrice( "V", in1Minute * 20, 0 );
_TRACE( "Volbar = " + Volbar );
*/
// Seconds Remaining

function GetSecondNum()
{
    Time       = Now( 4 );
    Seconds    = int( Time % 100 );
    Minutes    = int( Time / 100 % 100 );
    Hours    = int( Time / 10000 % 100 );
    SecondNum = int( Hours * 60 * 60 + Minutes * 60 + Seconds );
    return SecondNum;
}

RequestTimedRefresh( 1 );
TimeFrame = Interval();
SecNumber = GetSecondNum();
SecsLeft    = SecNumber - int( SecNumber / TimeFrame ) * TimeFrame;
SecsToGo    = TimeFrame - SecsLeft;

Secsleft = SecsToGo % 60 ;
Minleft = int( SecsToGo / 60 );

//Title = Title +"\n\\c07Min " +  Minleft + "\n\\c05Secs " + Secsleft ;
Title = Title + "\n\\c07 " +  Minleft + "\\c07 : " + "\\c07 " + Secsleft ;

// Zig-Hi-Zag-Lo formula
VolON = ParamToggle( "Plot Volume", "Off|On", 1 );
ZigON = ParamToggle( "Plot Zig", "Off|On", 1 );
pr = Param( "ZigZag change amount", 0.3, 0.05, 20, 0.05 );

pk = PeakBars( H, pr ) == 0;
tr = TroughBars( L, pr ) == 0;

zzHi = Zig( H, pr );
zzLo = Zig( L, pr );
Avg = ( zzHi + zzLo ) / 2;

x = IIf( pk, zzHi, IIf( tr, zzLo, IIf( Avg > Ref( Avg, -1 ), H, L ) ) );
zzHiLo = Zig( x, pr );

zzup = zzHiLo > Ref( zzHiLo, -1 ) ;
zzdn = zzHiLo < Ref( zzHiLo, -1 );
ribboncol = IIf( zzup , colorWhite, colorBlack );
// Plot the Zig ribbon
Plot ( 1, "", ribboncol, styleArea | styleOwnScale | styleNoLabel, 0, 100 );

if ( ZigON == 1 )
    Plot( zzHiLo, "", ribboncol , styleNoLabel );

//Swing Volume
Volswing = Sum( V, BarsSince( zzup != Ref( zzup, -1 ) ) + 1 );
SwingBar = BarsSince( zzHiLo != Ref( zzHiLo, -1 ) );

// plot Volume at 5% from bottom's pane
percent = Param( "PositTextVol%", 5, 2, 90, 0.5 );
xshift = Param( "xshift %", 4, 1, 90, 0.5 );
yshift = Param( "yshift %", 3, 1, 90, 0.5 );
Miny = Status( "axisminy" );
Maxy = Status( "axismaxy" );
y = Miny +  ( Maxy - Miny ) * percent / 100; // at 5 % above bottom of the
//pane
FirstVisibleBar = Status( "FirstVisibleBar" );
Lastvisiblebar = Status( "LastVisibleBar" );

for ( i = Firstvisiblebar + 1; i <= Lastvisiblebar AND i < BarCount - 1; i++ )
{
    if ( zzup [i] AND zzup [ i+1] == 0 )
    {
        if ( VolON == 1 )
        {
            PlotText( "" + Volswing [ i] , i - xshift , H[i] + yshift ,
colorWhite );
        }
    }

    if ( zzup [i] == 0 AND zzup [ i+1] == 1 )
    {
        if ( VolON == 1 )
        {
            PlotText( "" + Volswing [ i] , i - xshift , L[i] - yshift ,
colorBlack );
        }
    }
}

if ( VolON == 1 )
{
    PlotText( "" + Volswing , i + 2  , zzHiLo[BarCount-1], LastValue( ribboncol
) );
}

GraphXSpace = xspace;
0 comments
Leave Comment
Please login here to leave a comment.