Daily, Weekly and Monthly Pivots for Amibroker (AFL)
sam_u6 over 16 years ago Amibroker (AFL)
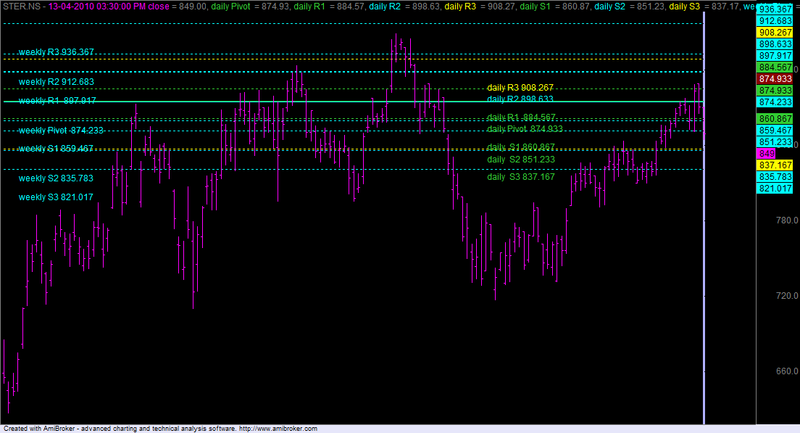
I found this afl author unknown,but its very useful for daytrading, buy above the trend in pivot, sell below the trend and sl will be the first price above the trend in case of short and vise versa.
Screenshots
Indicator / Formula
Copy & Paste Friendly
// Here is the formula can be used in amibroker. Since this formula has been posted by Avi ben a-avi111a.Actually
// I dont know who is he OR her. But by the if this formula benefits others then the purpose of this post will be successful.
// SUPER PIVOT POINTS can by used in 2 ways:
//
//  if you choose daily, the pivots are calculated from the previous day,
//
//  this can be used for daily charts.
//
//  the second option is next day for EOD charts.
//
//  for all the options available right click on the chart parameters.
//
//  to utilize all the program features you need amibroker from version 4.80.1
//  and above.

// Formula-Super Pivot ponts.
//-------------------------
_SECTION_BEGIN("pivots mw");
/***************************************/
/*SUPER PIVOT POINTS ver 1.3 day week month
by Avi b a
/***************************************/
/*
SUPER PIVOT POINTS can by used in 2 ways:
if you choose daily, the pivots are calculated from the previous day,
this can be used for daily charts.
the second option is next day for EOD charts.
for all the options available right click on the chart parameters.
to utilize all the program features you need amibroker from version 4.80.1 and above.
enjoy!
*/
/*-----------------data------------------*/
SetChartBkColor(16 ) ;
k=IIf(ParamList("select type","daily|next day")=="daily",-1,0);
k1=-1;
TimeFrameSet(inDaily);
day_h= LastValue(Ref(H,K));
day_l= LastValue(Ref(L,K));
day_c= LastValue(Ref(C,K));
TimeFrameRestore();

TimeFrameSet(inWeekly);
Week_h= LastValue(Ref(H,K1));
Week_l= LastValue(Ref(L,K1));;
Week_c= LastValue(Ref(C,K1));;
TimeFrameRestore();

TimeFrameSet(inMonthly);
month_h= LastValue(Ref(H,K1));
month_l= LastValue(Ref(L,K1));
month_c= LastValue(Ref(C,K1));
TimeFrameRestore();

/*--------------------------------------*/
// day
DH=Day_h;
DL=Day_L;
DC=Day_C;

// DAY PIVOT Calculation
pd = ( DH+ DL + DC )/3;
sd1 = (2*pd)-DH;
sd2 = pd -(DH - DL);
sd3 = Sd1 - (DH-DL);
rd1 = (2*pd)-DL;
rd2 = pd +(DH -DL);
rd3 = rd1 +(DH-DL);

// week
WH=Week_h;
WL=Week_l;
WC=Week_c;

// WEEK PIVOT Calculation
pw = ( WH+ WL + WC )/3;
sw1 = (2*pw)-WH;
sw2 = pw -(WH - WL);
sw3 = Sw1 - (WH-WL);
rw1 = (2*pw)-WL;
rw2 = pw +(WH -WL);
rw3 = rw1 +(WH-WL);

// month
MH=month_h;
ML=month_l;
MC=month_c;

// MONTH PIVOT Calculation
pm = ( MH+ ML + MC )/3;
sm1 = (2*pm)-MH;
sm2 = pm -(MH - ML);
sm3 = Sm1 - (MH-ML);
rm1 = (2*pm)-ML;
rm2 = pm +(MH -ML);
rm3 = rm1 +(MH-ML);

/*--------------------------------------*/
// PARAMETERS
slide =  Param("slide all",33,-1000,1000,1);
slide1 = Param("slide_day",50,0,1000,1);
slide2 = Param("slide_week",70,0,1000,1);
slide3 = Param("slide_month",90,0,1000,1);
slide_Hight =  Param("slide_Hight",0,-1000,1000,1);


SHALD = ParamList("daily Pivots", "all|selected only|hide" );
SHALW = ParamList("weekly Pivots", "selected only|all|hide" );
SHALM = ParamList("monthly Pivots", "selected only|all|hide" );

//day
PDP = ParamList("DP",   "SHOW|HIDE" );
PDR1 = ParamList("DR1", "SHOW|HIDE" );
PDR2 = ParamList("DR2", "HIDE|SHOW"  );
PDR3 = ParamList("DR3", "HIDE|SHOW" );

PDS1 = ParamList("DS1", "SHOW|HIDE" );
PDS2 = ParamList("DS2", "HIDE|SHOW" );
PDS3 = ParamList("DS3", "HIDE|SHOW" );


//week
PWP = ParamList("WP", "SHOW|HIDE" );
PWR1 = ParamList("WR1", "SHOW|HIDE" );
PWR2 = ParamList("WR2", "HIDE|SHOW" );
PWR3 = ParamList("WR3", "HIDE|SHOW" );

PWS1 = ParamList("WS1", "SHOW|HIDE" );
PWS2 = ParamList("WS2", "HIDE|SHOW" );
PWS3 = ParamList("WS3", "HIDE|SHOW" );

//month
PMP = ParamList("MP",   "SHOW|HIDE" );
PMR1 = ParamList("MR1", "SHOW|HIDE" );
PMR2 = ParamList("MR2", "HIDE|SHOW"  );
PMR3 = ParamList("MR3", "HIDE|SHOW" );

PMS1 = ParamList("MS1", "SHOW|HIDE" );
PMS2 = ParamList("MS2", "HIDE|SHOW" );
PMS3 = ParamList("MS3", "HIDE|SHOW" );

DayCOLOR = 34;
weekCOLOR =10;
monthCOLOR =42;
/*--------------------------------------*/
// LABELS
for( i = 0; i < BarCount; i++ )
{
 //day
 if(i+slide1== BarCount && (PDP=="SHOW" OR SHALD=="all") && SHALD!="hide") PlotText( "daily Pivot  "+pd ,i+slide,pd+slide_Hight ,DayCOLOR);
 if(i+slide1== BarCount && (PDR1=="SHOW" OR SHALD=="all")&& SHALD!="hide") PlotText( "daily R1  "+rd1 ,i+slide,rd1+slide_Hight ,DayCOLOR  );
 if(i+slide1== BarCount && (PDR2=="SHOW" OR SHALD=="all")&& SHALD!="hide") PlotText( "daily R2 "+rd2 ,i+slide,rd2+slide_Hight ,weekCOLOR  );
 if(i+slide1== BarCount && (PDR3=="SHOW" OR SHALD=="all")&& SHALD!="hide") PlotText( "daily R3 "+rd3 ,i+slide,rd3+slide_Hight ,monthCOLOR  );

 if(i+slide1== BarCount && (PDS1=="SHOW" OR SHALD=="all")&& SHALD!="hide") PlotText( "daily  S1 "+sd1 ,i+slide,sd1+slide_Hight ,DayCOLOR  );
 if(i+slide1== BarCount && (PDS2=="SHOW" OR SHALD=="all")&& SHALD!="hide") PlotText( "daily  S2 "+sd2 ,i+slide,sd2+slide_Hight ,DayCOLOR  );
 if(i+slide1== BarCount && (PDS3=="SHOW" OR SHALD=="all")&& SHALD!="hide") PlotText( "daily  S3 "+sd3 ,i+slide,sd3+slide_Hight ,DayCOLOR  );

 //week
 if(i+slide2== BarCount && (PWP=="SHOW"  OR SHALW=="all")&& SHALW!="hide") PlotText( "weekly Pivot  "+pw ,i+slide,pw+slide_Hight ,weekCOLOR );
 if(i+slide2== BarCount && (PWR1=="SHOW" OR SHALW=="all")&& SHALW!="hide") PlotText( "weekly R1  "+rw1 ,i+slide,rw1+slide_Hight ,weekCOLOR );
 if(i+slide2== BarCount && (PWR2=="SHOW" OR SHALW=="all")&& SHALW!="hide") PlotText( "weekly R2 "+rw2 ,i+slide,rw2+slide_Hight ,weekCOLOR );
 if(i+slide2== BarCount && (PWR3=="SHOW" OR SHALW=="all")&& SHALW!="hide") PlotText( "weekly R3 "+rw3 ,i+slide,rw3+slide_Hight ,weekCOLOR );

 if(i+slide2== BarCount && (PWS1=="SHOW" OR SHALW=="all")&& SHALW!="hide") PlotText( "weekly S1 "+sw1 ,i+slide,sw1+slide_Hight ,weekCOLOR );
 if(i+slide2== BarCount && (PWS2=="SHOW" OR SHALW=="all")&& SHALW!="hide") PlotText( "weekly S2 "+sw2 ,i+slide,sw2+slide_Hight ,weekCOLOR );
 if(i+slide2== BarCount && (PWS3=="SHOW" OR SHALW=="all")&& SHALW!="hide") PlotText( "weekly S3 "+sw3 ,i+slide,sw3+slide_Hight ,weekCOLOR );
 //month
 if(i+slide3== BarCount && (PMP=="SHOW"  OR SHALM=="all")&& SHALM!="hide") PlotText( "monthly Pivot  "+pm ,i+slide,Pm+slide_Hight ,monthCOLOR );
 if(i+slide3== BarCount && (PMR1=="SHOW" OR SHALM=="all")&& SHALM!="hide") PlotText( "monthly R1 "+rm1 ,i+slide,rm1+slide_Hight ,monthCOLOR );
 if(i+slide3== BarCount && (PMR2=="SHOW" OR SHALM=="all")&& SHALM!="hide") PlotText( "monthly R2 "+rm2 ,i+slide,rm2+slide_Hight ,monthCOLOR );
 if(i+slide3== BarCount && (PMR3=="SHOW" OR SHALM=="all")&& SHALM!="hide") PlotText( "monthly R3 "+rm3 ,i+slide,rm3+slide_Hight ,monthCOLOR );

 if(i+slide3== BarCount && (PMS1=="SHOW" OR SHALM=="all")&& SHALM!="hide")PlotText( "monthly S1 "+sm1 ,i+slide,sm1+slide_Hight ,monthCOLOR);
 if(i+slide3== BarCount && (PMS2=="SHOW" OR SHALM=="all")&& SHALM!="hide") PlotText( "monthly S2 "+sm2 ,i+slide,sm2+slide_Hight ,monthCOLOR );
 if(i+slide3== BarCount && (PMS3=="SHOW" OR SHALM=="all")&& SHALM!="hide") PlotText( "monthly S3 "+sm3 ,i+slide,sm3+slide_Hight ,monthCOLOR );
}
/*--------------------------------------*/
// PLOTS
style = IIf(ParamList("Chart style", "styleCandle|styleBar")=="styleCandle",64,128);
Plot (C,Date ()+" close",11,style);
 //day
 if ((PDP=="SHOW" OR SHALD=="all")  && SHALD!="hide") Plot (pd,"daily Pivot ",DayCOLOR,1);
 if ((PDR1=="SHOW" OR SHALD=="all") && SHALD!="hide") Plot (rd1,"daily R1 ",DayCOLOR,32);
 if ((PDR2=="SHOW" OR SHALD=="all") && SHALD!="hide") Plot (rd2,"daily R2 ",weekCOLOR,32);
 if ((PDR3=="SHOW" OR SHALD=="all") && SHALD!="hide") Plot (rd3,"daily R3 ",monthCOLOR,32);

 if ((PDS1=="SHOW" OR SHALD=="all") && SHALD!="hide") Plot (sd1,"daily S1 ",DayCOLOR,32);
 if ((PDS2=="SHOW" OR SHALD=="all") && SHALD!="hide") Plot (Sd2,"daily S2 ",WeekCOLOR,32);
 if ((PDS3=="SHOW" OR SHALD=="all") && SHALD!="hide") Plot (Sd3,"daily S3 ",monthCOLOR,32);

//week
 if ((PWP=="SHOW"  OR SHALW=="all") && SHALW!="hide") Plot (pW,"weekly Pivot ",weekCOLOR,1);
 if ((PWR1=="SHOW" OR SHALW=="all") && SHALW!="hide") Plot (rw1,"weekly R1 ",weekCOLOR,32);
 if ((PWR2=="SHOW" OR SHALW=="all") && SHALW!="hide") Plot (rw2,"weekly R2 ",weekCOLOR,32);
 if ((PWR3=="SHOW" OR SHALW=="all") && SHALW!="hide") Plot (rw3,"weekly R3 ",weekCOLOR,32);

 if ((PWS1=="SHOW" OR SHALW=="all") && SHALW!="hide") Plot (sw1,"weekly S1 ",weekCOLOR,32);
 if ((PWS2=="SHOW" OR SHALW=="all") && SHALW!="hide") Plot (Sw2,"weekly S2 ",weekCOLOR,32);
 if ((PWS3=="SHOW" OR SHALW=="all") && SHALW!="hide") Plot (Sw3,"weekly S3 ",weekCOLOR,32);

 //month
 if ((PMP=="SHOW"  OR SHALM=="all") && SHALM!="hide") Plot (pm,"monthly Pivot",monthCOLOR ,1);
 if ((PMR1=="SHOW" OR SHALM=="all") && SHALM!="hide") Plot (rm1,"monthly R1",monthCOLOR ,32);
 if ((PMR2=="SHOW" OR SHALM=="all") && SHALM!="hide") Plot (rm2,"monthly R2",monthCOLOR ,32);
 if ((PMR3=="SHOW" OR SHALM=="all") && SHALM!="hide") Plot (rm3,"monthly R3",monthCOLOR ,32);

 if ((PMS1=="SHOW" OR SHALM=="all") && SHALM!="hide") Plot (sm1,"monthly S1",monthCOLOR ,32);
 if ((PMS2=="SHOW" OR SHALM=="all") && SHALM!="hide") Plot (sm2,"monthly S2",monthCOLOR ,32);
 if ((PMS3=="SHOW" OR SHALM=="all") && SHALM!="hide") Plot (sm3,"monthly S3",monthCOLOR ,32);
/*--------------------------------------*/
// TEXT
"high  = "+H;
"low   =  "+L;
"close = "+C;
//style color

style = styleNoLine | styleNoRescale;
rcolor = colorDarkRed;
scolor = colorDarkGreen;
pcolor = colorPink;
Plot(pd, "pd",rcolor,style);

_SECTION_END();
2 comments
Leave Comment
Please login here to leave a comment.
Thank you
Thank you. What is the relationships of daily, weekly and monthly? How to apply them for trading?