Percentage of AD for Amibroker (AFL)
prasadbrao over 13 years ago Amibroker (AFL)
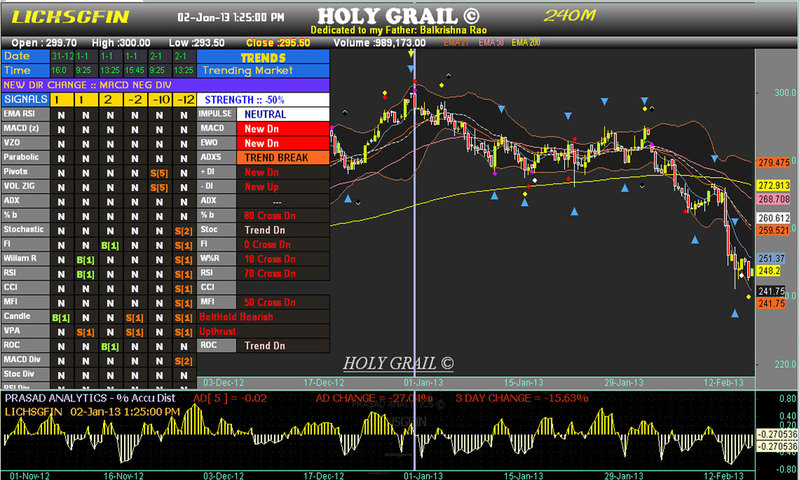
Refer Chart 2 – Below Holy Grail for Percentage AD
Screenshots
Indicator / Formula
Copy & Paste Friendly
 SetChartBkColor( ParamColor("Chart Color", colorBlack));

GraphXSpace = 10;

_SECTION_BEGIN("BACKGROUD LTRS");
SetChartOptions(0,chartShowArrows|chartShowDates);
GfxSetOverlayMode(1);

GfxSetTextAlign( 6 );// center alignment
GfxSetTextColor( ParamColor("Text Color", ColorHSB( 42, 42, 42 ) ));
GfxSetBkMode(0); // transparent


GfxSelectFont("Tahoma", Status("pxheight")/12);
GfxTextOut( "PRASAD ANALYTICS ©", Status("pxwidth")/2, Status("pxheight")/14);

GfxSelectFont("Tahoma", Status("pxheight")/9 );
GfxTextOut( Name(), Status("pxwidth")/2, Status("pxheight")/4.1 );


GfxSelectFont("Arial Narrow", Status("pxheight")/28 );
GfxTextOut( "prasad9rao@gmail.com", Status("pxwidth")/2, Status("pxheight")/1.5);

GfxSelectFont("arial narrow", Status("pxheight")/27 );
GfxTextOut( "Dedicated to MY FATHER : BALKRISHNA RAO", Status("pxwidth")/2, Status("pxheight")/1.15);
_SECTION_END();


k = (GetPerformanceCounter()/100)%256;
printf("GetPerformance Counter %g",k);

GfxSelectFont("Arial Narrow", 10,700 );
GfxSetBkMode(1);
GfxSetTextColor(colorYellow);
//GfxTextOut("Dedicated to the loving memory of MY FATHER",100+k ,26);

RequestTimedRefresh(1);
_SECTION_END();


VOLDAYS1 = Param("AD DAYS",5,1,50,1);


AD_PER = Sum((Close-Open)/(High-Low)*Volume,VOLDAYS1)/Sum(Volume,VOLDAYS1);


mycolorAD =IIf  (AD_PER<0,ColorRGB(252,255,200) , IIf( AD_PER>0,ColorRGB(252,255,0),ColorRGB(125,84,11)));

RATEADOFCHANGE = (AD_PER - Ref(AD_PER,-1)) * 100;

DayCHANGE = Sum(RATEADOFCHANGE,3);

Plot(AD_PER,"AD%",mycolorAD ,styleHistogram|styleThick);
Plot(AD_PER,"AD%",mycolorAD ,styleLine);


/****************************************************
                   CHART TITLES
****************************************************/


GfxSetTextAlign( TA_left = 0);
GfxSelectFont("Tahoma", 11, 700 );
GfxSetTextColor(ColorRGB(209,191,255));
GfxTextOut("PRASAD ANALYTICS - % Accu Dist",07, 0);


GfxSetTextAlign( TA_LEFT = 0 );
GfxSelectFont("Tahoma", 11, 700 );
GfxSetTextColor(ColorRGB(255,180,61));
GfxTextOut(Name()+ "   " + Date(),07,18);

GfxSetTextColor(colorBrown);
GfxTextOut("AD[ "+VOLDAYS1+" ]"+" = "+NumToStr(AD_PER,1.2),275, 0);


GfxTextOut("AD CHANGE"+" = "+NumToStr(RATEADOFCHANGE,1.2)+"%",450,0);


GfxTextOut("3 DAY CHANGE"+" = "+NumToStr(DayCHANGE,1.2)+"%",650,0);

/**************** AD***************************/


Title = " ";
17 comments
Leave Comment
Please login here to leave a comment.
Kindly please share chart 1.Really usefull for trading.
http://www.wisestocktrader.com/indicators/2885-holy-grail
this is Prasad Rao’s Original Holy Grail Formula posted at wisestocktreades.com
prasadbro kindly share first chart
_As posted by Mr. Divyesh this – http://www.wisestocktrader.com/indicators/2885-holy-grail was the beginning of HOLY GRAIL.
But due to many criticisms received for it I do not post ne HOLY GRAILS. It is a hard work I have put in since 3 years developing and testing it each single day. I do not wish to share it with sadists who name it as bull shit and fooly grail.
I am sorry but plz dont ask me to share the HOLY GRAIL.
Regards,
Prasad Rao._
HI Prasad Rao,
I completely agree with you.I have read the harsh comments that was passed upon you. That was bad and unacceptable. But remember that was their opinion. I am a firm believer that any indicator is useful when you try to intercept it and use it in a constructive way.
Anyway can you please share the idea and indicators used in your holy grain indicator(IF YOU DON’T MIND).
THANKS
Hi…Prasad sir..we value your hard work,pls continue to contribute
your thoughts and trading exploration for the good of traders.
you have simplified complex trading,don’t mind criticism..its part
of life which makes one move higher place,GOD BLESS.
CHEARS
Dear hmsanil, jk
The Trading Concept of HOLY GRAIL
1. The first left side column is the combination of Trend Indicators, Oscillators and Volume Based Indicators.
2. Column 2nd – 7th display the Buy/ Sell of the respective signals in column 1.
3. Row 1 and 2 are the date and time of last 7 trading candles.
4. Row 3 is a major commentary which tells abt trend.
5. Row 4 is the total Buy minus Total sell of corresponding 2nd to 7th column .
6. Column 8 and 9 display the major oscillators strength / Impulse / ADX strength.
=========
I started TA 3 yrs back and thought of creating a system. I went thru many books reading abt various indicators. I started with Master Charts 1 and renamed it later as HOLY GRAIL.
As with every one I failed in the trading system initially. But went to to explore more and more.
Just a thought of all the TA GOD FATHERS " There is no single indicator which is perfect" A system has to be a combination of 10 to 15 good indicators consisting of Price Indi, Volume Indi and Price plus Vol Indi.
Thats what made HOLY GRAIL.
As seen in the above chart when I get more than 9 signals I look out for trend and strength.
Trends and strength begin with smaller time frames. I refer Hourly, 240 M, Daily and weekly to decide a perfect buy/sell.
When I get major buy signals on a hourly time frame I wait for the strength to come into 240. This way i catch the bottoms. Further the stock which shall be negative on daily shows signs of loosing its negative trend. And finally if the weekly is positive I take a call. Caution but if the weekly is negative I wait for the stock to rise till its 21 day weekly EMA and again short it.
When a stock looses steam there come simultaneous green signals or red signals and it starts with lower time frames. There happen to be many divergences and many times in 2 to 3 time frames. This further confirms the move up or down.
Also note that if I get many buy signals and strength on a daily dosent means the stock will move up. This has to be supported with the higher and lower time frames.
The above is just a idea I programmed into HOLY GRAIL after repeated readings/viewings of books and video tutorials of Steve Nison, Richard Demille Wyckoff,Gerald Appel,J. Welles Wilder,Dr Alexander Elder,Charles B. Schaap,Marc Chaikin,Larry Williams and many more authors without whom my HOLY GRAIL could not have been developed.
Regards and wish u all success in ur life.
Prasad Rao.
Dear Prasad,Please share the holy grail. We all value you ideas.Pl share.
Regards,
Gopak
Hi Prasad Rao,
Thank you very very much,
I have heard TRADING IS ART,Today I understood through you what it really means.The way you put in effort,learn, understand really impressed me.
I have very Little coding knowledge, but still i will try to understand and create indicator . Thank you
If you don’t mind can you please share your mail id.
Thanks
Dear hmsanil
my id is prasad9rao@gmail.com
NB: To, Admin I hope we can share email ids here.
Hi Prasad Rao,
Thank you very much
Hi,
Prasad Rao,
Really awesome work…u have really gone in details about working with amibroker formula’s and making it graphically covering all IMP indicators values visible to users, and we can make changes according to our requirement about value input on those indicators..so in a way its saves time to go through many charts.
Thanks for sharing you hard works with us.
May god bless you with such good idea’s and make working hours short of you as well as of users with whom you share it.
Regards,
Sameer
*"The above is just a idea I programmed into HOLY GRAIL after repeated readings/viewings of books and video tutorials of Steve Nison, Richard Demille Wyckoff,Gerald Appel,J. Welles Wilder,Dr Alexander Elder,Charles B. Schaap,Marc Chaikin,Larry Williams and many more authors without whom my HOLY GRAIL could not have been developed.
Regards and wish u all success in ur life.
Prasad Rao."*
================
Respected Prasad jee,
Really u hav done very hard work as above list of all “Veteran & Successful Traders” is more than sufficient for yur really hard work…yur 3 years hard work is really great.Me too often attracted by Wyckoff—& 240EMA
One more rqst Sir jee—As Light as Dark, As Soft as Hard, on this globe u will find diffrnt attitudes—so filter them out for the sake of common beneficiary.
So get the POSITIVE 9 SIGNALS from yur beleiver/follower & do for them.
Thanks
_As posted by Mr. Divyesh this – http://www.wisestocktrader.com/indicators/2885-holy-grail was the beginning of HOLY GRAIL.
========
Plz do post the complete one.
Thanks
~hyraj
Dear Prasad jee,
I downloaded yur both *% Intraday Intensity for Amibroker &Percentage of AD for Amibroker * indicators:
But they are showing only lower pane.(Lower pane Indicator)
I hav AmiBroker5.3 Professional.
~hyraj
hyraj, no need to post duplicate comments. The author only shared the bottom pane.
@Admin
Thanks