Stock Portfolio Organizer
The ultimate porfolio management solution.
Shares, Margin, CFD's, Futures and Forex
EOD and Realtime
Dividends and Trust Distributions
And Much More ....
WiseTrader Toolbox
#1 Selling Amibroker Plugin featuring:
Advanced Adaptive Indicators
Advanced Pattern Exploration
Neural Networks
And Much More ....
RSI Trendlines and Wedges for Amibroker (AFL)
Rating:
5 / 5 (Votes 1)
Tags:
amibroker, exploration, pattern, rsi
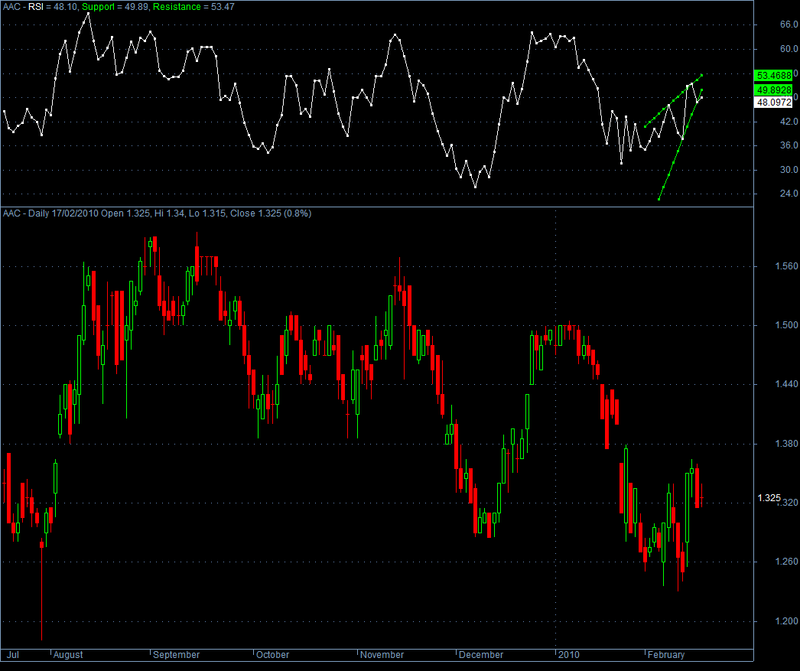
The formula plots recent [or previous] RSI trendlines in Indicator Builder mode.
In Automatic Analysis mode, explore for the n=1 last quotations for Ascending or Descending Wedges and the respective probable bearish or bullish breakouts.
By Dimitris Tsokakis – tsokakis [at] oneway.gr
Screenshots
Similar Indicators / Formulas
Pennant Chart Pattern Exploration
Submitted
by kaiji over 16 years ago
Candlestick Pattern Finder
Submitted
by theone3000 over 15 years ago
Head & Shouders
Submitted
by pvsy over 15 years ago
Double Dojis Exploration
Submitted
by ami4me about 13 years ago
Double Top Detection
Submitted
by sougatab over 15 years ago
Price Projection by Gann ( Murray Math lines)
Submitted
by kv_maligi about 14 years ago
Indicator / Formula
Copy & Paste Friendly
/*RSI Trendlines and Wedges*/
G=0;// set G=1, 2, 3, ... to see previous Resistance trendlines
GG=0;// set G=1, 2, 3, ... to see previous Support trendlines
x = Cum(1);
per = 1;// sensitivity calibration
s1=RSI();s11=RSI();
Plot(RSI(),"RSI",2,8);
pS = TroughBars( s1, per, 1 ) == 0;
endt= LastValue(ValueWhen( pS, x, 1+GG ));
startt=LastValue(ValueWhen( pS, x, 2+GG ));
dtS =endt-startt;
endS = LastValue(ValueWhen( pS, s1, 1+GG ) );
startS = LastValue( ValueWhen( pS, s1, 2+GG  ));
aS = (endS-startS)/dtS;
bS = endS;
trendlineS = aS * ( x  -endt ) + bS;// the Support trendline equation
Plot(IIf(x>startt-6 AND TRENDLINES>0 AND
TRENDLINES<100,trendlineS,-1e10),"Support",IIf(as>0,5,4),8);
pR = PeakBars( s11, per, 1 ) == 0;
endt1= LastValue(ValueWhen( pR, x, 1+G ));
startt1=LastValue(ValueWhen( pR, x, 2+G ));
dtR =endt1-startt1;
endR = LastValue(ValueWhen( pR, s11, 1+G ) );
startR = LastValue( ValueWhen( pR, s11, 2 +G ));
aR = (endR-startR)/dtR;
bR = endR;
trendlineR = aR * ( x  -endt1 ) + bR;// the Resistance trendline equation
Plot(IIf(x>startT1-6  AND TRENDLINER>0 AND
TRENDLINER<100,trendlineR,-1e10),"Resistance",IIf(Ar>0,5,4),8);
Ascwedge=Ar>0.5  AND As>sqrt(2)*Ar AND trendlineR>trendlineS;
Descwedge= As<-0.5 AND As>Ar/sqrt(2) AND trendlineR>trendlineS;
Filter=1;
AddColumn(Ascwedge,"AscWedge",1.0);
AddColumn(DescWedge,"DesWedge",1.0);
AddColumn(Ascwedge AND trendlineS>50 AND RSI()>50,"Probable Bearish Breakout",1.0);
AddColumn(Descwedge AND trendlineR<50 AND RSI()<50,"Probable Bullish Breakout",1.0);
0 comments
Leave Comment
Please login here to leave a comment.
Back