STOP LOSS for Amibroker (AFL)
hermix about 13 years ago Amibroker (AFL)
FORMULA STOP LOSS
Screenshots
Indicator / Formula
Copy & Paste Friendly
// Parameters
PeriodEMA = 13;
MACDIndicatorRange = 50;
// Volume filter
VolumeFilter = Param( "Volume MA filter", 100000, 50000, 500000, 100000 );
Timeframe = Interval(2);
// Adjust for weekly if necessary
if( Timeframe == "5-day" || Timeframe == "Weekly" ) {
VolumeFilter = VolumeFilter * 5;
}
else if( Timeframe == "Monthly") {
VolumeFilter = VolumeFilter * 20;
}
else if( Timeframe != "Daily" ) {
VolumeFilter = 0;
}
// Minimum number of bars required to form a divergence pattern. For a
// positive divergence, this is the number of falling bars in the context
// of a rising MACD or MACD-H pattern. Vice versa for negative divergence
MACDDivMinWidth = Param("Divergence min width", 4, 1, 10, 1 );
// Minimum width of negative projecting wave between two positive MACD-H waves,
// otherwise two positive waves will be considered as one single wave. This
// minimises invalid divergences, to ensure that "back of bears is broken".
// The same applies for a positive wave between two negative waves.
HistMinWidth = Param("Histogram min width", 4, 1, 10, 1 );
PeriodEMA = Optimize( "PeriodEMA ", 13, 5, 23, 1 );
// Other parameters
OpenPositions = 10;
ATRPeriod = 5;
InitialCapital = 100000;
PeriodFast = Param( "Fast EMA", 12, 2, 200, 1 );
PeriodSlow = Param( "Slow EMA", 26, 2, 200, 1 );
PeriodSignal = Param( "Signal EMA", 9, 2, 200, 1 );
MACDInd = MACD(PeriodFast, PeriodSlow );
SigInd = Signal(PeriodFast, PeriodSlow , PeriodSignal );
HistInd = MACDInd - SigInd ;
_N( macdStr = WriteVal( PeriodFast, 1.0 )+","+WriteVal( PeriodSlow , 1.0 ) );
_N( sigStr = macdStr + ","+WriteVal( PeriodSignal , 1.0 ) );
// Get displayed min and max value of MACD and MACD-H, to rescale it for better visibility
scMACDMax = LastValue(HHV(Max(MACDInd, sigInd),
BarsSince( Status("barvisible") AND NOT Ref(Status("barvisible"),-1) )));
scMACDMin = LastValue(LLV(Min(MACDInd, sigInd),
BarsSince( Status("barvisible") AND NOT Ref(Status("barvisible"),-1) )));
scaleMACD = Max( abs(scMACDMax), abs(scMACDMin) );
scHistMax = LastValue(HHV(HistInd,
BarsSince( Status("barvisible") AND NOT Ref(Status("barvisible"),-1) )));
scHistMin = LastValue(LLV(HistInd,
BarsSince( Status("barvisible") AND NOT Ref(Status("barvisible"),-1) )));
scaleHist = Max( abs(scHistMax), abs(scHistMin) );
_SECTION_BEGIN("Patterns Wave");
Change = Param("Wave Period",7,0,100,1);
SupResA = Param("Sup-Res A Period",20,0,100,1);
SupResB = Param("Sup-Res B Period",25,0,100,1);
Res1 = ParamColor("Resistance High", colorYellow | styleThick);
Res2 = ParamColor("Resistance Low", colorYellow | styleThick);
Sup1 = ParamColor("Support High", colorBlue| styleThick);
Sup2 = ParamColor("Support Low", colorBlue| styleThick);
procedure PlotShapeAt( x, y, shape, shift )
{
PlotShapes( IIf( BarIndex() == x, shape, 0 ), colorWhite, 0, y, shift );
}
bi = BarIndex();
sbi = SelectedValue( bi );
GraphXSpace = 2;
upshift = 80;
if( SelectedValue( PeakBars( C, Change ) < TroughBars( C, Change ) ) )
{
pt1 = PeakBars( C, Change, 1 ) == 0 ;
pt2 = TroughBars( C, Change, 1 ) == 0 ;
}
else
{
pt1 = TroughBars( C, Change, 1 ) == 0 ;
pt2 = PeakBars( C, Change, 1 ) == 0 ;
upshift = -upshift;
}
bpt1 = SelectedValue( ValueWhen( pt1, bi ) );
bpt2 = SelectedValue( ValueWhen( pt2, bi ) );
bpt3 = SelectedValue( ValueWhen( pt1, bi, 2 ) );
bpt4 = SelectedValue( ValueWhen( pt2, bi, 2 ) );
bpt5 = SelectedValue( ValueWhen( pt1, bi, 3 ) );
bpt6 = SelectedValue( ValueWhen( pt2, bi, 3 ) );
PlotShapeAt( bpt1, C, shapeDigit5, upshift );
PlotShapeAt( bpt2, C, shapeDigit4, -upshift );
PlotShapeAt( bpt3, C, shapeDigit3, upshift );
PlotShapeAt( bpt4, C, shapeDigit2, -upshift );
PlotShapeAt( bpt5, C, shapeDigit1, upshift );
_SECTION_END();
_SECTION_BEGIN("Support-Resistance");
//Plot( Close, "Close", colorWhite, styleCandle );
MaxGraph = 12;
BuyOffSet = SupResA;
//Optimize("BuyOffSet",18,15,20,1);
SellOffset = BuyOffSet;
//Optimize("SellOffset",2,2,14,2);
RegLength = 5;
//Optimize("RegLength",5, 2,11,2);
BuyATRPeriod = 2;
//Optimize("BuyATRPeriod",2,2,5,1);
SellATRPeriod = BuyATRPeriod;
//Optimize("SellATRPeriod",4,2,11,2);
ATRMultiplier = 0.5;
//Optimize("ATRMultiplier",1,0.7,1.25,.05);
Graph8 = HHV(H-ATRMultiplier*ATR(BuyATRPeriod),BuyOffset); /* RED */
Graph9 = LLV(L+ATRMultiplier*ATR(SellATRPeriod),SellOffset) ; /* GREEN */
ave=(Graph8+Graph9)/2;
Graph8Style=Graph9Style = styleNoTitle|styleLine;
Graph9Color= Sup1; /* 5 is green */
Graph8Color = Res2; /* 4 is red */
nn=SupResB;
mmm=100;
TYP=(High + Low + 2*Close)/4;
CI=(TYP-MA(TYP,14))/(0.015*StDev(TYP,14));
CCCI=EMA(CI,5)+mmm;
Hh=HHV(H,nn);
Ll=LLV(L,nn);
MM=(Hh+Ll)/2;
CCCC=EMA(CCCI*(Hh-Ll)/(2*mmm)+Ll,5);
Plot(Hh,"High Reistance",Res1,styleLine|styleNoTitle) ;
Plot(Ll,"Low Suport",Sup2,styleLine|styleNoTitle);
_SECTION_END();
_SECTION_BEGIN("Price");
SetChartOptions(0,chartShowArrows|chartShowDates);
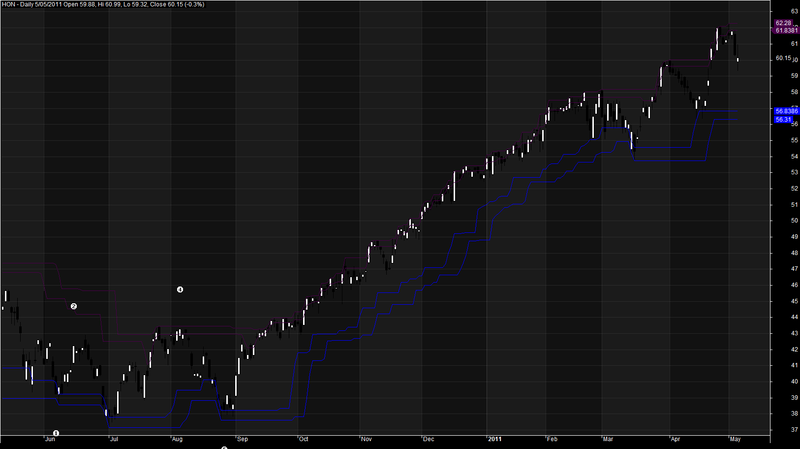
_N(Title = StrFormat("{{NAME}} - {{INTERVAL}} {{DATE}} Open %g, Hi %g, Lo %g, Close %g (%.1f%%) {{VALUES}}", O, H, L, C, SelectedValue( ROC( C, 1 ) ) ));
Plot( C, "Close", ParamColor("Color", colorBlack ), styleNoTitle | ParamStyle("Style") | GetPriceStyle() );
_SECTION_END();2 comments
Leave Comment
Please login here to leave a comment.
how to play with this?
Pattern wave not drawn-only support and resistance lines- changing parameters do not affect on chart