Intraday Trading Setup for Amibroker (AFL)
sudhir12192 over 16 years ago Amibroker (AFL)
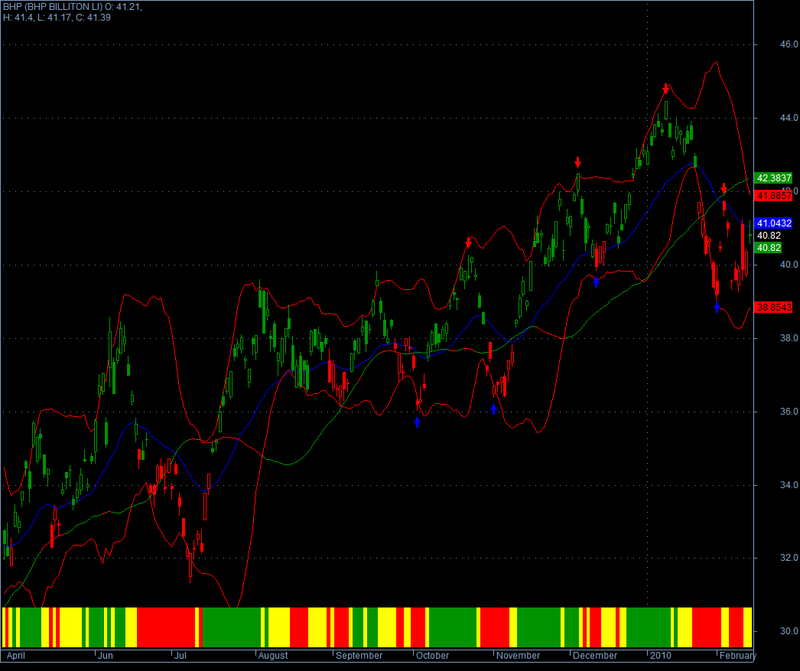
THIS IA A UNIQUE INTRADAY TRADING SETUP USING MANY INDICATORS TO GIVE BUY AND SELL SIGNALS.
Screenshots
You cannot view the code for the following reasons:
- You must be a member and have contributed at least 1 indicator
13 comments
Leave Comment
Please login here to leave a comment.
good afl
This afl is FORWARD LOOKING. It is only fit for doing post mortem. This one is a complete waste.
thnx
gud work
grttt
Please send me this AFL to my email id Removed to test and post results.
Asking for formulas is against the rules. Please refrain from doing so.
_SECTION_BEGIN(“Stochastic”);
periods = Param( “Periods”, 15, 1, 200, 1 );
Ksmooth = Param( “%K avg”, 3, 1, 200, 1 );
Dsmooth = Param( “%D avg”, 3, 1, 200, 1 );
myStochD=StochD( periods , Ksmooth, DSmooth );
myStochK=StochK( periods , Ksmooth);
Overbought=80;
Oversold=20;
Buy = Cross(myStochK, myStochD );
Sell = Cross( myStochD, myStochK );
Plot( myStochD, “Stochastic %D”+_PARAM_VALUES(), ParamColor( “ColorD”, colorRed ), ParamStyle(“StyleD”) );
Plot( myStochK, “Stochastic %K”, ParamColor( “ColorK”, colorGreen ), ParamStyle(“StyleK”) );
PlotShapes(IIf(Sell, shapeHollowDownArrow , shapeNone), colorRed);
PlotShapes(IIf(Buy, shapeHollowUpArrow , shapeNone), colorBlue);
Plot(Overbought,“Overbought Level”,colorRed);
Plot(Oversold,“Oversold Level”,colorGreen);
PlotOHLC( myStochK,myStochK,50,myStochK, "", colorRed, styleCloud | styleClipMinMax, 20, 80 );
PlotOHLC( myStochD,myStochD,50,myStochD, "", colorYellow, styleCloud | styleClipMinMax, 20, 80 );
PlotOHLC( Null,myStochD,myStochK,Null, "", colorBlue, styleCloud);
_SECTION_END();
Hi,
Please could you explain what the colored bars below the graph and the middle row changes color (blue / red), thanks.
_SECTION_BEGIN(“ibrah”);
SetChartOptions(0,chartShowArrows|chartShowDates);
SetChartBkColor(ParamColor(“Outer panel”,colorBlack)); // color of outer border
SetChartBkGradientFill( ParamColor(“Inner panel upper”,colorBlack),ParamColor(“Inner panel lower”,colorBlack));
tchoice=Param("Title Selection ",2,1,2,1);
//// Vchart
//This was converted from code created for TradeStation by Mark W. Helweg of ValueCharts.com
VarNumbars = Param(“Number of candlestick”,5,2,1000,1);
Color = Param(“Bar Color”,colorBlue);
Top = Param(“Top Chart Line”,8);
TopMid = Param(“Top Mid Chart Line”,4);
BottomMid = Param(“Bottom Mid Chart Line”,-4);
Bottom = Param(“Bottom Chart Line”,-8);
Plot(Top,“Top Chart Line”,colorRed);
Plot(TopMid,“Top Mid Chart Line”,colorLightGrey);
Plot(BottomMid,“Bottom Mid Chart Line”,colorLightGrey);
Plot(Bottom,“Bottom Chart Line”,colorRed);
LRange = 0;
VarP = round(VarNumBars/5);
if (VarNumBars > 7)
{
VarA=HHV-LLV;
VarR1 = IIf(VarA0 AND VarP1,abs(C-Ref(C,-Varp)),VarA);
VarB=Ref(HHV,-VarP+1)-Ref(LLV,-VarP);
VarR2 = IIf(VarB0 AND VARP1,abs( Ref(C,-VarP)-Ref(C,-Varp*2) ),VarB);
VarC=Ref(HHV,-VarP*2)-Ref(LLV,-VarP*2);
VarR3 = IIf(VarC == 0 AND VarP==1,abs(Ref(C,-Varp*2)-Ref(C,-Varp*3)),VarC);
VarD = Ref(HHV,-VarP*3)-Ref(LLV,-VarP*3);
VarR4 = IIf(VarD == 0 AND VarP==1,abs(Ref(C,-Varp*3)-Ref(C,-Varp*4)),VarD);
VarE = Ref(HHV,-VarP*4)-Ref(LLV,-VarP*4);
VarR5 = IIf(VarE == 0 AND VarP==1,abs(Ref(C,-Varp*4)-Ref(C,-Varp*5)),VarE);
LRange=((VarR1+VarR2+VarR3+VarR4+VarR5)/5)*.2;
};
CDelta = abs(C – Ref(C,-1));
if (VarNumBars <=7)
{
Var0 = IIf(CDelta > (H-L) OR H==L,CDelta,(H-L));
LRange = MA*.2;
}
MidBarAverage = MA/2,VarNumbars);
VOpen = (Open- MidBarAverage)/LRange;
VHigh = (High-MidBarAverage)/LRange;
VLow = (Low-MidBarAverage)/LRange;
VClose = (Close-MidBarAverage)/LRange;
PlotOHLC(VOpen,VHigh,VLow,VClose,“ValueChart”,color,styleCandle| styleThick ,-12,12);
Title= Name() + " " + WriteVal( DateTime(), formatDateTime )+
“\nVOpen " + VOpen + “\n”+ " VHigh "+ VHigh + “\n”+ " VLow " + Vlow + “\n”+ " VClose " + VClose;
Filter = Volume > 50000;
AddColumn( VOpen, “VOpen”);
AddColumn( VHigh, “VHigh”);
AddColumn( VLow, “VLow”);
AddColumn( VClose, “VClose”);
_SECTION_END();
thaaaaaaaaaaaaaaaaaaaaaaanks
WHY MUST SHARE