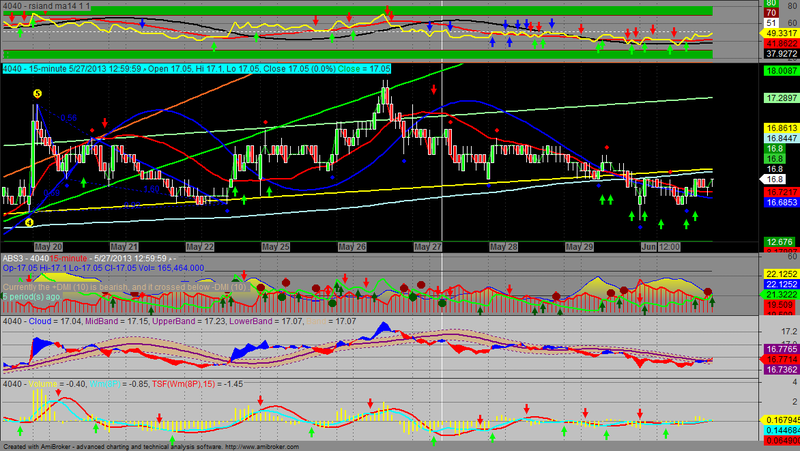
VolumeOscillator amajeed best trade for Amibroker (AFL)
haman about 13 years ago Amibroker (AFL)
new formolla from my mind ,its VolumeOscillator advanced with average
i think its best of the best
i hobe to you more winning.
its work for all time frames.
Screenshots
Indicator / Formula
Copy & Paste Friendly
_SECTION_BEGIN("VolumeOscillator");
/* Volume Oscillator */
/* Indicator, system, and exploration */
/* Steve Wiser slwiserr@erols.com */
SetChartBkColor(ParamColor("Panel Color",colorLightGrey));
SetChartBkGradientFill(ParamColor("Upper Chart",colorLightGrey),ParamColor("Lower Chart",colorLightGrey));

PlusDM= IIf(High>Ref(High,-1) AND Low>=Ref(Low,-1), High-Ref(High,-1),
                 IIf(High>Ref(High,-1) AND Low<Ref(Low,-1)
                 AND High-Ref(High,-1)>Ref(Low,-1)-Low,
                High-Ref(High,-1),0));

Vm=log(EMA(V,3));

b= (C-L)*Vm+ (H-O)*Vm +
         IIf(C>O,(C-O)*Vm,0) + PlusDM*Vm +
         IIf(Ref(C,-1)<O,(O-Ref(C,-1))*Vm,0);

MinDM = IIf(Low<Ref(Low,-1)   AND  High<=Ref(High,-1), Ref(Low,-1)-Low,
               IIf(High>Ref(High,-1) AND Low<Ref(Low,-1)
               AND High-Ref(High,-1)<Ref(Low,-1)-Low, Ref(Low,-1)-Low, 0));

s= (H-C)*Vm + (O-L)*Vm +
         IIf(C<O,(O-C)*Vm,0) + MinDM*Vm +
         IIf(Ref(C,-1)>O,(Ref(C,-1)-O)*Vm,0);

Wm=Wilders(Wilders(b,3)-Wilders(s,3),3);
Wm1=MA(Wm,8);
Color=IIf(Wm >10,colorBlue,IIf(Wm < -10,colorRed,7));
Plot(Wm,"Volume",Color,2|styleThick);
Plot(Wm1,"Wm(8P)",10,styleLine|styleThick);
Plot(0,"",ParamColor("Zero Line",colorGrey50),styleLine|styleNoLabel);
/*Plot(100,"",32,styleLine|styleThick | styleNoLabel);
Plot(-100,"",12,styleLine|styleThick | styleNoLabel);
Plot(50,"",9,styleLine | styleNoLabel|styleThick);
Plot(-50,"",9,styleLine | styleNoLabel|styleThick);*/


_SECTION_END();

_SECTION_BEGIN("TSF");
P = ParamField("Price field",-1);
Periods = Param("Periods", 15, 2, 300, 1, 10 );
Plot( TSF( P, Periods ), _DEFAULT_NAME(), ParamColor( "Color", colorRed), ParamStyle("Style") );
_SECTION_END();

_SECTION_BEGIN("KP TrendBias BackGround");//Plot Tone
dummy =  E_TSKPTRENDBIAS(High,Low,Close);
KPTB = tskp_sb;
KPTBSlow = tskp_tbxavg;
parmToneColorUp=ParamColor("Tone Color Up", colorLightBlue );
parmToneColorDn=ParamColor("Tone Color Dn", colorTan);
RibbonSize=Param("Ribbon Size",20,0.5,10,0.5);
_SECTION_END();
r= wm1;

_SECTION_END();

Buy=Cross(r, TSF( P, Periods ));
Sell=Cross(TSF( P, Periods ),r);

PlotShapes(IIf(Buy,Buy*1,shapeNone),colorBrightGreen,0,r,-15);

PlotShapes(IIf(Sell,Sell*2,shapeNone),colorRed,0,r,-15);
1 comments
Leave Comment
Please login here to leave a comment.
sir,
plz tell the name of indicator wich is situated in 2nd from lower .cloud wala