Candle Ribbon for Amibroker (AFL)
brevco over 16 years ago Amibroker (AFL)
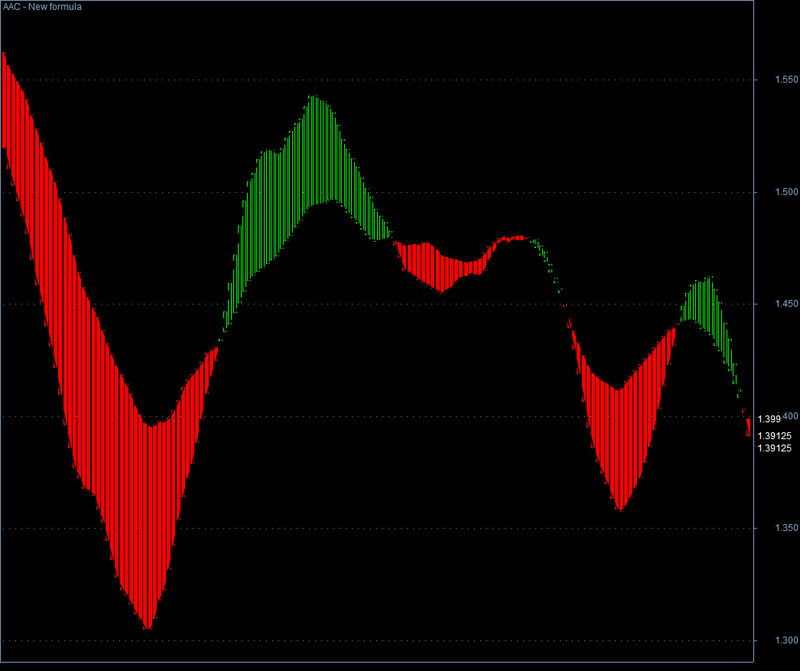
This code Draws a RIBBON made of Candle Bodies between 2 MAs.
As the MAs Cross the colors alternate with the Colors defined in
Preferances – Colors – Up/Down Candlestick.
The code can easily be modified to draw a Ribbon between any 2
lines (indicator/oscillators) as noted below.
Jack Kinsey 8-3-05
Screenshots
Indicator / Formula
Copy & Paste Friendly
_SECTION_BEGIN("Candle Ribbon");

/*

This code Draws a RIBBON made of Candle Bodies between 2 MAs.

As the MAs Cross the colors alternate with the Colors defined in

Preferances - Colors - Up/Down Candlestick.

The code can easily be modified to draw a Ribbon between any 2

lines (indicator/oscillators) as noted below.

Jack Kinsey 8-3-05

*/

GraphXSpace = 5;

P1 = Param("P1", 20, 1, 200, 1); // Parameters for moving Avgs

P2 = Param("P2", 50, 1, 200, 1);

//Plot( C, "", colorWhite, styleCandle); // Plot "ACTUAL" Price Candles

//theROC = ROC(C , 1);

//theROC = round(theroc*100)/100;

/*************************** START CODE THAT CREATES & PLOTS RIBBON ******/

rC = MA(C, P1); // Change Temporary Price arrays

rO = EMA(C, P2); // to Moving averages.

/* Modify the above 2 lines to PLOT Ribbon between any other 2 Lines/Oscillators. */

/* EXAMPLE: Replace "rC = MA(C, P1);" with "rC = YourLine1;" */

/* AND Replace "rO = EMA(C, P2);" with "rO = YourLine2;" */

/* The rest you shouldn't need to change except maybe colors */


rH = IIf(C >= O, rC, rO); // Remove HI/LO Shadows

rL = IIf(C <= O, rC, rO);


C=rc; O=ro; H=rh; L=rl; // Temp Adjust Actual PRICE Arrays


Plot( C, "", colorBlack, styleLine| styleThick);

Plot( O, "", colorBlack, styleLine|styleThick);

Plot( C, "", colorBlack, styleCandle); // Plot spread between MAs as Candles

RestorePriceArrays (); // Restore Price Arrays

/************************** END CREATE & PLOT RIBBON CODE *************************/
0 comments
Leave Comment
Please login here to leave a comment.