Stock Portfolio Organizer
The ultimate porfolio management solution.
Shares, Margin, CFD's, Futures and Forex
EOD and Realtime
Dividends and Trust Distributions
And Much More ....
WiseTrader Toolbox
#1 Selling Amibroker Plugin featuring:
Advanced Adaptive Indicators
Advanced Pattern Exploration
Neural Networks
And Much More ....
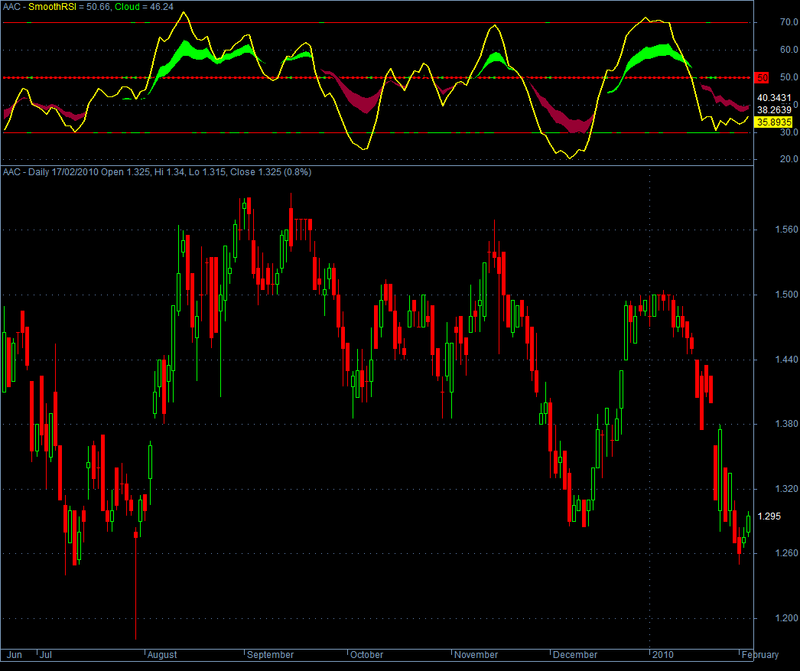
Smoothed RSI Buy Signals for Amibroker (AFL)
Rating:
3 / 5 (Votes 4)
Tags:
oscillator, trading system, amibroker, exploration, rsi
Credit for this indicator goes to: Mubashar Virk. Explanation of its use is included in the .afl
Screenshots
Similar Indicators / Formulas
Weissman RSI & MA System
Submitted
by jarjis_sk over 16 years ago
Smooth Rsi Buy
Submitted
by aminctg almost 16 years ago
demark overbought and oversold indicator
Submitted
by pras almost 16 years ago
RSI Double-Bottom
Submitted
by kaiji over 16 years ago
ADX color side way
Submitted
by four7 almost 16 years ago
CCI + DPO + MACD
Submitted
by sm_d about 16 years ago
2 comments
Leave Comment
Please login here to leave a comment.
Back
nice work
Here is a modified version of the same indicator:
//Source: http://www.wisestocktrader.com/indicatorpasties/117-smoothed-rsi-buy-signals
_SECTION_BEGIN(“Background”);
SetChartOptions(0,chartShowArrows|chartShowDates);
SetChartBkColor(ParamColor(“Outer panel”,colorDarkOliveGreen)); // color of outer border
_SECTION_END();
_SECTION_BEGIN(“Smoothed RSI Buy Signals”);
SetBarsRequired(500,0);
showsig= ParamList(“Show Buy and sell signals?”,“Yes|No”);
//n1=7,n2=14,n3=21
n1= 7;
n2=n1*2;
n3=n1*3;
Plot(EMA (RSI,5), “SmoothRSI”, colorYellow,styleThick);
Cc=EMA (RSI,5);
A=EMA (RSI,5);
B=EMA (RSI,5);
Plot(A,“RSI 2”,ColorRGB(100,150,150), styleLine);
Plot(B,"",ColorRGB(100,150,150), styleLine);
PlotOHLC( 0, A , B ,B , “Cloud”, IIf(Cc > b AND Cc>50 ,colorBrightGreen,IIf(cc>b AND cc<50, colorBlue,IIf(cc<b AND cc>50, colorBlue,colorRed))), styleCloud|styleNoLabel);
Color30=IIf(V>EMA(V,10),colorBrightGreen,colorRed);
Color50=IIf(V>1.5*EMA(V,10),colorBrightGreen,colorRed);
Color70=IIf(V>2*EMA(V,10),colorBrightGreen,colorRed);
Plot(50, "", color50,styleDots, styleNoLabel);
Plot(30, "", color30, styleNoLabel);
Plot(70, "", color70, styleNoLabel);
if(showsig==“Yes”)
{
Buy=Cross(Cc,a);
Sell=Cross(b,Cc);
Buy=ExRem(Buy,Sell);
Sell=ExRem(Sell,Buy);
shape=Buy*shapeUpArrow + Sell*shapeDownArrow;
PlotShapes(shapeUpArrow*Buy, colorLime, 0, A, -35 );PlotShapes(shapeDownArrow*Sell, colorRed, 0, A, -35 );
}
Filter= V > 1.5*EMA (V, 10)AND EMA (RSI,5)<40 AND Cross( EMA (RSI,5), EMA (RSI,5));
AddColumn(Close,“Close”,1.2);
AddColumn(Volume,“Volume”,1.0);
AddColumn(V/EMA,“Vspurt”,1.0);
AddColumn( RSI;
AddColumn( ROC, “ROC”, 1.2 );
AddColumn( MFI;
AddColumn( OBV;
AddColumn( CCI;
AddColumn( Ultimate(), “Ultimate”, 1.4 );
_SECTION_END();
Hope you all like it!!