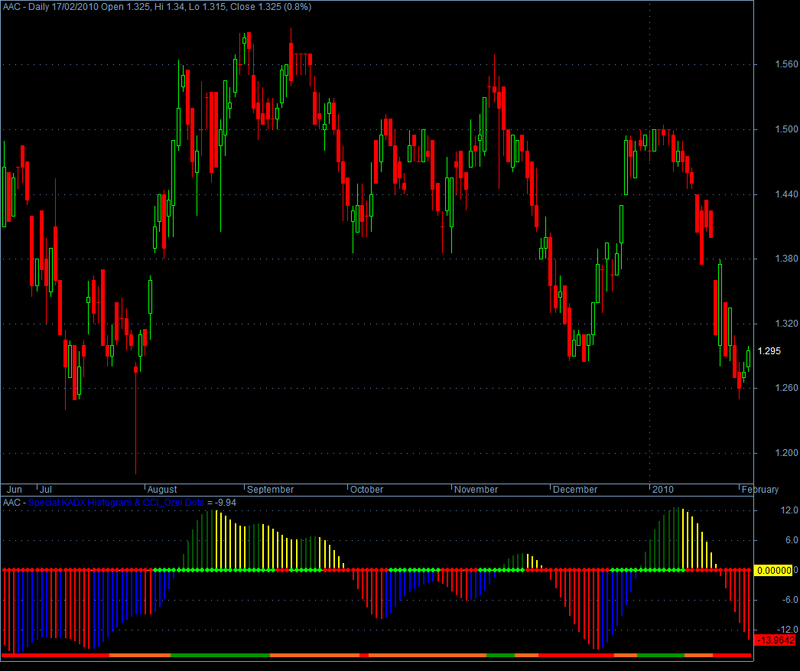
Special KADX Oscillator for Amibroker (AFL)
investor over 16 years ago Amibroker (AFL)
Special KADX is an oscillator form derived from the KADX (some kind of special ADX).
Screenshots
Indicator / Formula
Copy & Paste Friendly
_SECTION_BEGIN("Special KADX Oscillator");
SetChartBkColor(colorBlack);

SetBarsRequired(500,0);
PI = 3.1415926;
T1 = Param("Momentum Period",5,0,100,1);

A=C-Ref(C,-T1);
a[0]=C[0];
function IIR2( input, f0, f1, f2 )
{
    result[ 0 ] = input[ 0 ];
    result[ 1 ] = input[ 1 ];

    for( i = 10; i < BarCount; i++ )
    {
       result[ i ] = f0 * input[ i ] +
                     f1 * result[ i - 1 ] +
                     f2 * result[ i - 2 ];
    }

   return result;
}

function GSMA( input, Period )
{
  N = 0;
  an = 2 * PI / Period;
  c0 = b0 = 1;
  c1 = b1 = b2 = a1 = a2 = gamma1 = 0;
  beta1 = 2.415 * ( 1- cos( an ) );
  alpha = -beta1 + sqrt( beta1 ^ 2 + 2 * beta1 );
  alpha1 = ( cos( an ) + sin( an ) - 1 )/cos( an );
   {
    fo = alpha ^ 2;
    f1 = 2 * ( 1- alpha ); f2 = -( 1 - alpha )*( 1 - alpha );
  }


  return IIR2( input, fo,f1,f2);
}
period=Param("period",15,1,40,1);

H1=gsma(H,period);
L1=gsma(L,period);
p = Param("adx+d-d",14,1,100,1);

PDM=IIf(H1>Ref(H1,-1) AND L1>=Ref(L1,-1), H1-Ref(H1,-1),IIf(H1 >Ref(H1,-1) AND L1<Ref(L1,-1)
AND H1-Ref(H1,-1)> Ref(L1,-1)-L1, H1-Ref(H1,-1),0));

MDM=IIf(L1<Ref(L1,-1) AND H1<=Ref(H1,-1), Ref(L1,-1)-L1,IIf(H1>Ref(H1,-1) AND L1<Ref(L1,-1)
AND H1-Ref(H1,-1)<Ref(L1,-1)-L1, Ref(L1,-1)-L1,0));


PlDI=100*Wilders(PDM,P)/ATR(P);
MIDI=100*Wilders(MDM,P)/ATR(P) ;

K=PlDI-MIDI;

ifish=EMA(EMA(EMA(EMA(K,3),3),3),3);
Color=IIf(ifish>0,IIf(ifish>Ref(ifish,-1),colorDarkGreen,colorYellow),IIf(ifish>Ref(ifish,-1),colorBlue,colorRed));
Plot(ifish,"Special KADX Histogram & CCI_Ozel Dots",Color,styleHistogram | styleThick, maskHistogram);
Plot(0,"",colorYellow,styleDashed);
_SECTION_END();
_SECTION_BEGIN("DOTS For CC_Ozel");

a1=EMA(CCI(5),3);
a2=EMA(CCI(10),3);
a3=EMA(CCI(15),3);
b1=StDev(a1,5);
b2=StDev(a2,10);
b3=StDev(a3,15);
RMOV=((a1*b1)+(a2*b2)+(a3*b3))/(b1+b2+b3);
K1=EMA(EMA(EMA(RMOV,3),3),3);

PlotShapes(IIf(K1 > 0,shapeSmallCircle,shapeNone),colorBrightGreen,0,0,0);
PlotShapes(IIf(K1 <= 0,shapeSmallCircle,shapeNone),colorRed,0,0,0);

_SECTION_END();

_SECTION_BEGIN("Trend Direction and Force Index Ribbon");
MMA=EMA(C,15);
SMMA=EMA(MMA,15);
IMPETMMA=MMA - Ref(MMA,-1);
IMPETSMMA=SMMA - Ref(SMMA,-1);
DIVMA= abs(MMA - SMMA);
AVERIMPET= (IMPETMMA+IMPETSMMA)/2;
K1=DIVMA;
K2=AVERIMPET*AVERIMPET*AVERIMPET;
TDF= K1*K2;
NTDF1=EMA(TDF/HHV(abs(TDF),15*3),3)*100;
NTDF=EMA(NTDF1,3);
Bull_Trend=NTDF>4;
Bear_Trend=NTDF<=-4;
Ribbon_kol=IIf(Bull_Trend,colorGreen, IIf(Bear_Trend,colorRed, colorOrange));
Plot(2, "", Ribbon_kol, styleOwnScale|styleArea|styleNoLabel, -0.5,100);

_SECTION_END();
0 comments
Leave Comment
Please login here to leave a comment.