MACD Histogram for Amibroker (AFL)
mrugen over 16 years ago Amibroker (AFL)
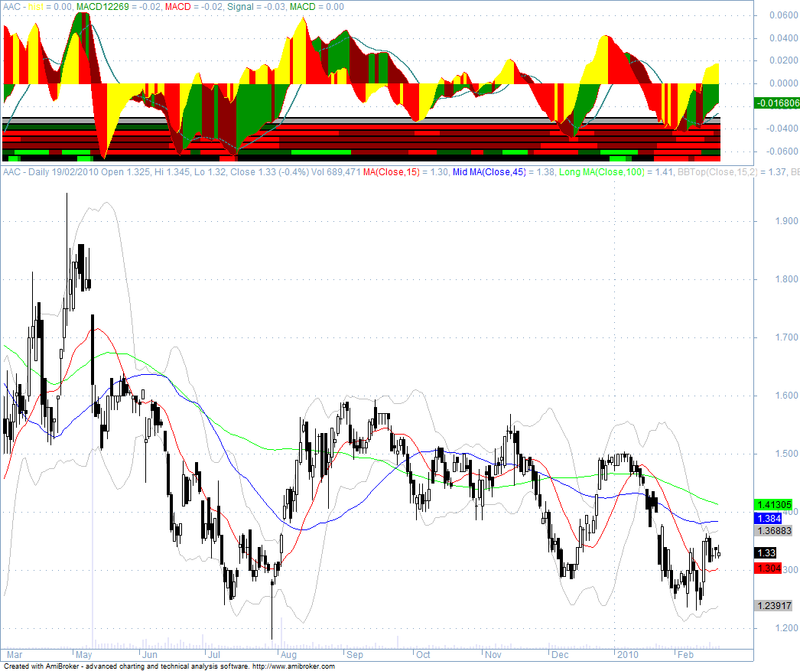
MACD Histogram with lots of color. The only way to find out what it means is to read the code.
Screenshots
Indicator / Formula
Copy & Paste Friendly
_SECTION_BEGIN("MACD_12-26-9+HIST + ADXR band");
r1 = Param( "Fast avg", 12, 2, 200, 1 );
r2 = Param( "Slow avg", 26, 2, 200, 1 );
r3 = Param( "Signal avg", 9, 2, 200, 1 );
m1= MACD(r1,r2);
s1= Signal(r1,r2,r3);
//////////////////////////////////////////////   HIST  //////////////////////////////////////

hist=m1-s1;
Colorhist=IIf(hist>Ref(hist,-1),colorYellow,colorRed);

Plot( hist*2, "MACD Histogram", Colorhist, styleNoTitle | ParamStyle("Histogram style", styleHistogram | styleNoLabel, maskHistogram ) );
Plot( hist*2, "MACD Histogram", Colorhist, styleNoTitle | styleNoLabel, maskHistogram );
PlotOHLC( 0, hist*2, 0 , 0 , "hist",Colorhist, styleCloud | styleNoLabel);
/////////////////////////////////////// MACD  //////////////////////////////////////////////////////////////////

Colorm=IIf(m1>Ref(m1,-1),colorGreen,colorDarkRed);
Plot( m1, "MACD12269", Colorm, styleHistogram );
Plot( m1, "MACD", colorRed, styleNoLabel );

Plot( s1, "Signal", colorTeal, styleNoLabel|styleThick);
PlotOHLC( 0, m1, 0 , 0 , "MACD",Colorm, styleCloud | styleNoLabel);
////////////////////////////////////////////    ADXR  BAND  //////////////////////////////////////////////////////

pds=14;
Adxr = ( ADX(pds) + Ref( ADX(pds), -14 ) )/2;
//Plot(ADxr,"",colorWhite,4);

//Plot( PDI(14), "+DI",ColorRGB(0,100,20),styleThick | styleNoLabel);
//Plot( MDI(14), "-DI",ColorRGB(100,0,20),styleThick | styleNoLabel);
A = PDI(14);
B = MDI(14);

//PlotOHLC( 0, A , B , B , "Cloud", IIf(A > B ,ColorRGB(0,25,10),ColorRGB(35,0,10)), styleCloud | styleNoLabel);

ColorA=IIf(ADXr>25,IIf(A>B,IIf(ADXr>EMA(ADXr,3),colorBrightGreen,colorGreen),IIf(ADXr>EMA(ADXr,3),colorRed,colorDarkRed)),colorBlack);


Plot( 3,"",ColorA, /* choose color */styleOwnScale|styleArea|styleNoLabel, -0.5, 100 );
Plot( 4,"",colorBlack, /* choose color */styleOwnScale|styleArea|styleNoLabel, -0.5, 100 );

//////////////////////////////////////////////////  MACD TRENDING BAND /////////////////////////////////////////////////////////////////

r1_5=r1*5;
r2_5=r2*5;
m_5= MACD(r1_5, r2_5);
s_5= Signal(r1_5,r2_5,r3);


r1_10=r1*10;
r2_10=r2*10;
m_10= MACD(r1_10, r2_10);
s_10= Signal(r1_10,r2_10,r3);


r1_20=r1*20;
r2_20=r2*20;
m_20= MACD(r1_20, r2_20);
s_20= Signal(r1_20,r2_20,r3);


r1_40=r1*40;
r2_40=r2*40;
m_40= MACD(r1_40, r2_40);
s_40= Signal(r1_40,r2_40,r3);


r1_80=r1*80;
r2_80=r2*80;
m_80= MACD(r1_80, r2_80);
s_80= Signal(r1_80,r2_80,r3);


ColorT=IIf(m1>0,IIf(m1>s1,colorBrightGreen,colorDarkRed),IIf(m1<s1,colorRed,colorDarkGreen));
Plot( 7,"",ColorT, /* choose color */styleOwnScale|styleArea|styleNoLabel, -0.5, 100 );
Plot( 8,"",colorBlack, /* choose color */styleOwnScale|styleArea|styleNoLabel, -0.5, 100 );


ColorT5=IIf(m_5>0,IIf(m_5>s_5,colorBrightGreen,colorDarkGreen),IIf(m_5<s_5,colorRed,colorDarkRed));
Plot( 11,"",ColorT5, /* choose color */styleOwnScale|styleArea|styleNoLabel, -0.5, 100 );
Plot( 12,"",colorBlack, /* choose color */styleOwnScale|styleArea|styleNoLabel, -0.5, 100 );

ColorT10=IIf(m_10>0,IIf(m_10>s_10,colorBrightGreen,colorDarkGreen),IIf(m_10<s_10,colorRed,colorDarkRed));
Plot( 15,"",ColorT10, /* choose color */styleOwnScale|styleArea|styleNoLabel, -0.5, 100 );
Plot( 16,"",colorBlack, /* choose color */styleOwnScale|styleArea|styleNoLabel, -0.5, 100 );

ColorT20=IIf(m_20>0,IIf(m_20>s_20,colorBrightGreen,colorDarkGreen),IIf(m_20<s_20,colorRed,colorDarkRed));
Plot( 19,"",ColorT20, /* choose color */styleOwnScale|styleArea|styleNoLabel, -0.5, 100 );
Plot( 20,"",colorBlack, /* choose color */styleOwnScale|styleArea|styleNoLabel, -0.5, 100 );

ColorT40=IIf(m_40>0,IIf(m_40>s_40,colorBrightGreen,colorDarkGreen),IIf(m_40<s_40,colorRed,colorDarkRed));
Plot( 23,"",ColorT40, /* choose color */styleOwnScale|styleArea|styleNoLabel, -0.5, 100 );
Plot( 24,"",colorBlack, /* choose color */styleOwnScale|styleArea|styleNoLabel, -0.5, 100 );

ColorT80=IIf(m_80>0,IIf(m_80>s_80,colorBrightGreen,colorDarkGreen),IIf(m_80<s_80,colorRed,colorDarkRed));
Plot( 27,"",ColorT80, /* choose color */styleOwnScale|styleArea|styleNoLabel, -0.5, 100 );
Plot( 28,"",colorBlack, /* choose color */styleOwnScale|styleArea|styleNoLabel, -0.5, 100 );
_SECTION_END();
0 comments
Leave Comment
Please login here to leave a comment.