OsMA - Moving Average of Oscillator for Amibroker (AFL)
extremist over 12 years ago Amibroker (AFL)
I had searched for this indicator but failed to find.
So i made it myself.
Nothing great logic.
very simple
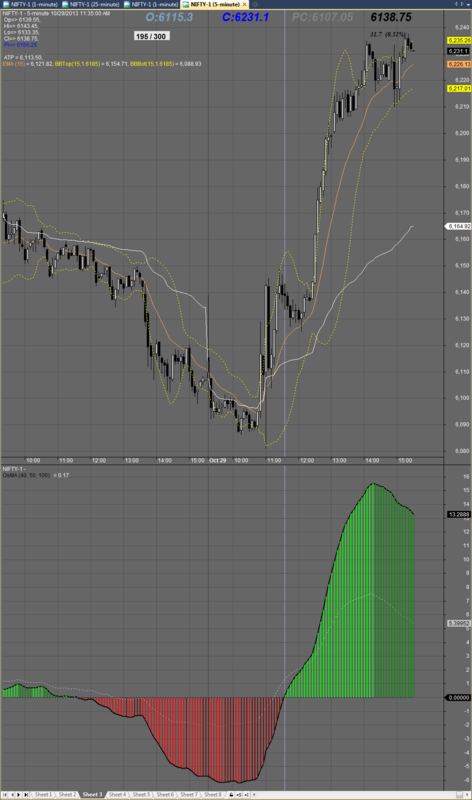
but effective in 5 min chart for nifty
u chk with ur settings as per ur needs
thanx
rhn_patel@rediffmail.com
Screenshots
Indicator / Formula
Copy & Paste Friendly
_SECTION_BEGIN("OsMA");
r1 = Param( "Fast avg", 40, 0, 200, 1 );
r2 = Param( "Slow avg", 50, 0, 200, 1 );
r3 = Param( "Signal avg", 100, 0, 200, 1 );

ml = MACD(r1, r2);
sl = Signal(r1,r2,r3);
OsMA= (2*ml)-sl;

Plot(0,"",colorBlack,styleDashed);
Col=IIf(OsMA<0,IIf(OsMA>Ref(OsMA,-1),colorDarkRed,colorRed),IIf(OsMA<Ref(OsMA,-1),colorGreen,colorBrightGreen));
Plot( OsMA, "", Col, styleThick | styleHistogram |styleNoLabel);
Plot( OsMA, "\nOsMA ("+r1+", "+r2+", "+r3+"): ", colorBlack, styleThick  );
_SECTION_END();
6 comments
Leave Comment
Please login here to leave a comment.
hi
an interesting indicator. let me know what is the best time frame to be used . also how to trade by this?
ravi
qatar
i chked it in todays live mkt in comparison to original OsMa in MT4 and found tht
It is still an unfinished job.
i thought it is finished but still some left.
i’m trying
and wil post final version.
thnx
even now it looks very promising.looking forward to the fuller version :)
@niklravi : read the above lill description i have already mentioned it.
for parameters keep the default i used and TF 5min for nifty.
for other stocks and indices need to be chked and then used so i said select ur parameters as u need.
thanx.
I believe that the OsMA is just the MACD Histogram but the implementation ia probably where the signal line of OsMA uses simple moving average (instead of EMA) of the MACD.
i.e.
@ KIS probably u didn’t looked formula properly.
The real
Osma = Sl-Ml
and the formula used in MACD Histogram is
Hist = ml-sl
this is the clear cut difference u can see
for better understanding u chk the values of histogram and OsMa
and u can find the difference.
plz look carefully