Stock Portfolio Organizer
The ultimate porfolio management solution.
WiseTrader Toolbox
#1 Selling Amibroker Plugin featuring:
TD Clone points and trendlines for Amibroker (AFL)
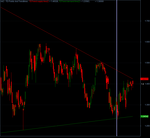
A clone version of the Demark Trendlines produced from connecting two deman or two supply points. Indicator includes parametrization that allows selection of the level, choice of the trendline having extensions and ability to request display of the Demand/Supply points used to create the trendline. Indicator also includes ability to display the breakout qualifiers. Code based on description provided in the Demark book “New Science of Technical Analysis”
Screenshots
Similar Indicators / Formulas
16 comments
Leave Comment
Please login here to leave a comment.
Back
(One of) The best!
Hi Moren,
Hoe to interpret this indicator.Hpw to find out buy and sell signals.
Request you to kindly comment.
Thanks,
Gopal
To Gopal
I put on webpage my buy/sell system with TD Clone.
I hope administrator will accept to publish.
Some ideas:
-this system I use with end-of-day data;
-I execut Amibroker Scan with this system within a 2-3 days period, meaning current day+yesterday+the day before yesterday;
-I observe carefully how system works because it is a “moving system”, meaning a buy signal can appears after a 1-2 days, so I execut Amibroker Scan within a 2-3 days period.
Hope to be clear and useful.
Morgen
Here is the link: http://wisestocktrader.com/indicators/1625-buy-td-clone-tgl
Thanks Morgen for your comments.
I find it somewhat useful even for intraday as I have some observations noted when I have replayed the bars.But not so sure as to how to clearly identify the buy and sell conditions using the green and red trendlines.
One method is to wait till the trendline closes on the candle and take buy/sell decision accordingly. Let me know if there is any other way of interpreting.
Request you comments for the benefit of other users.
Thanks,
Gopal
To Gopal
I trade in End-Of-Day data only.
The best buy is when appears blue up arrow: after green line-red line cross,green line is above red line and price is maitaining above green line.
To Gopal
See Buy&TD Clone&TGL here in Wisestocktrader , with my ideas.
Nice
kliul
plz mail me formula plz any body help me i am radhika and my email id is radhika177@yahoo.com plz mail me this formula
thanks
thanks,want to look!
Comment hidden - Show
thanks,want to look!
excellent.Thank you. Hope the work continues.
thank