Percentage Price Change Between Selected Dates for Amibroker (AFL)
stevewalsh over 9 years ago Amibroker (AFL)
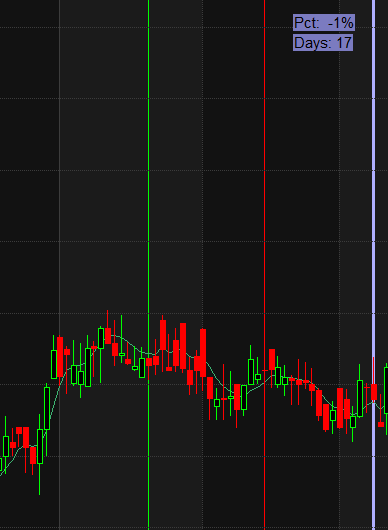
Select the first date on the chart using F12, then the last date with Shift+F12. You will see the percentage change in the price and the number of days between the two selected dates on your chart (top right). You can change the value used to Open, Close, etc.
Screenshots
Indicator / Formula
Copy & Paste Friendly
_SECTION_BEGIN( "F12" );
// Works out the percentage change between the selected days
// and displays the change and days on the chart.
//F12 (Start) and Shift-F12 (End). Clear Ctrl-F12
Price = ParamField( "Price", 0 );
Start = BeginValue( BarIndex() );
End = EndValue( BarIndex() );
Days = End - Start;
ValStart = BeginValue( Price );
ValEnd = EndValue( Price );
Diff = ValEnd - ValStart;
Pct = ( Diff / ValStart ) * 100;
GfxSetBkColor( colorBlueGrey );
GfxTextOut( "Pct: " + NumToStr( Pct, 3 ) + "%", 1200 , 20 );
GfxTextOut( "Days: " + Days, 1200 , 40 );
_SECTION_END();
10 comments
Leave Comment
Please login here to leave a comment.
Good.thanks
Very Clever
Awesome, needed something like this
Cheers
thank you for your god indicator, although it is also capable for using in other timeframes for example 1h, 4h, 15 Min, etc. with slightly changing it is usefull in forex
Not Worked
Please Fixed
The formula works fine. You probably have an old version of Amibroker that doesn’t support Gfx functions.
Can not select by pressing F12, in my Dell by F12 it increases the brightness. i am using AmiBroker 6.20.1
Thanks for Reply
You can also select two points on the chart by double clicking on the chart in one spot then double clicking in another spot.
Thanks! Good work.