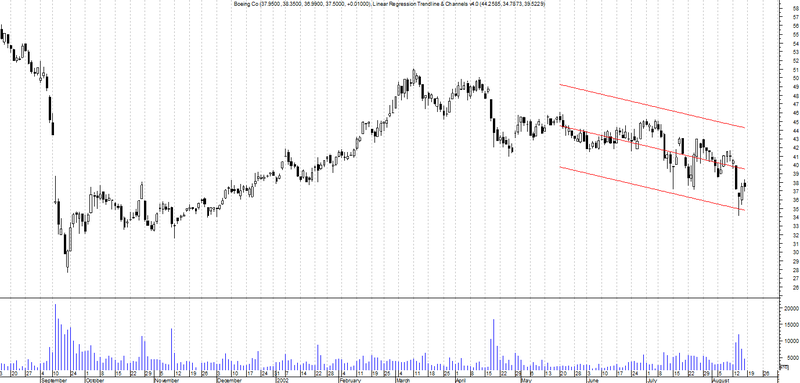
Linear Regression Trendline & Channels v4.0 for Metastock
Linear Regression Trendline with Standard Deviation/Error Channels/Bands, date-adjustable. Like all trendlines, this uses hindsight and is dynamic. Do not use to generate trading signals.
Created By Jose Silva at metastocktools.com
Screenshots
Indicator / Formula
Copy & Paste Friendly
MetaStock -> Tools -> Indicator Builder -> New -> Copy & paste complete formulae below.
{ Linear Regression Trendline & Channels v4.0

Like all trendlines, this uses hindsight and is dynamic. Do not use to generate trading signals.

Copyright © 2004-2008 Jose Silva.
The grant of this license is for personal use
 only - no resale or repackaging allowed.
All code remains the property of Jose Silva.
http://www.metastocktools.com }

{ User Inputs }
pds:=Input("Linear Regression Trendline periods",2,2520,63);
multi:=Input("Standard Deviations(+) / Errors(-)",-100,100,2);
EnDay:=Input("end Day",1,31,31);
EnMnth:=Input("end Month",1,12,12);
EnYear:=Input("end Year",1800,2200,2010);
x:=Input("use: Open=1 Hi=2 Lo=3 Close=4 WghtCl=5 Volume=6",1,6,4);
x:=If(x=1,O,If(x=2,H,If(x=3,L,If(x=5,WC(),If(x=6,V,C)))));

{ End date point }
end:=Year()>EnYear
 OR (Year()=EnYear AND (Month()>EnMnth
 OR Month()=EnMnth AND DayOfMonth()>=EnDay));
end:=end AND Alert(end=0,2);
end:=If(LastValue(Cum(Ref(end,pds)))=0,
 LastValue(Cum(1))=Cum(1),end);

{ Linear Regression Trend/Slope end-points }
lastValLRI:=LastValue(Highest(
 If(end,LinearReg(x,pds),0)));
lastValLRS:=LastValue(Highest(
 If(end,LinRegSlope(x,pds),-10000)));
adjust:=LastValue(LastValue(Cum(1))
 -Highest(If(end,Cum(1),0)));
countback:=LastValue(Cum(1))-Cum(1)-adjust;

{ Rem next line to extend plot to end of chart }
countback:=Ref(Ref(countback,-adjust),adjust);

{ Lin Reg Trendline }
LR:=lastValLRI-lastValLRS*countback;
restrict:=adjust-(LastValue(Cum(1))-pds);
LRT:=Ref(Ref(LR,-restrict),restrict);

{ Lin Reg StdDev/StdError channels }
bandType:=If(multi>=0,Stdev(x,pds),STE(x,pds));
diff:=ValueWhen(1,Cum(IsDefined(LRT))=1,
 bandType*Abs(multi));
upLR:=LRT+diff;
lwLR:=LRT-diff;

{ Plot on price chart }
upLR;lwLR;LRT
0 comments
Leave Comment
Please login here to leave a comment.