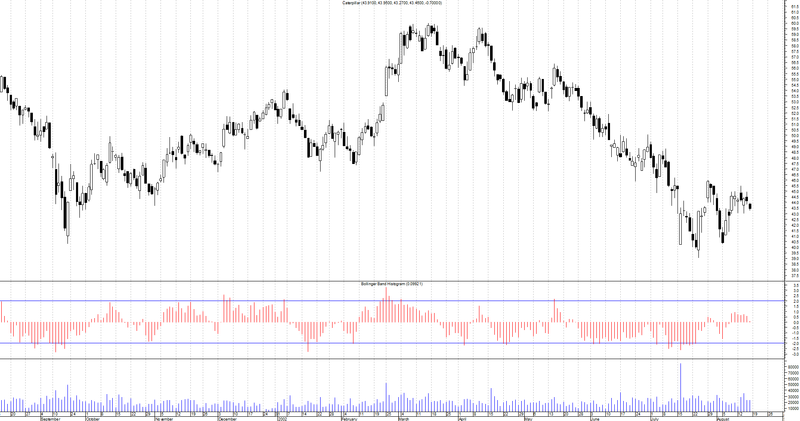
Bollinger Band Histogram by Steve Karnish for Metastock
Recently, the “group” was able to supply me with the formula for making a Histogram out of the “bands”. I find this the most useful application of Bollinger’s formula.
Under “properties”, I then drop in +2 and -2 (because I’m not bright enough to program them in permanently). I think this is a much better view of the bands. As the price moves up and down as a % of the band width, all the classic applications of other “oscillator type” indicators work well (divergence, support/resistance, and overbought/oversold conditions when the price exceeds the Standard Dev. of +/-2).
This is just one of ten indicators that I use … but, for traders trying to understand Bollinger’s “envelopes”, I think this reconfiguration gives a simpler, cleaner view which allows the technician to analyse the underlying issue without the “squiggles”.
from Steve Karnish
Screenshots
Files
0 comments
Leave Comment
Please login here to leave a comment.