Ichimoku Cloud Charts for Amibroker (AFL)
Alok over 16 years ago Amibroker (AFL)
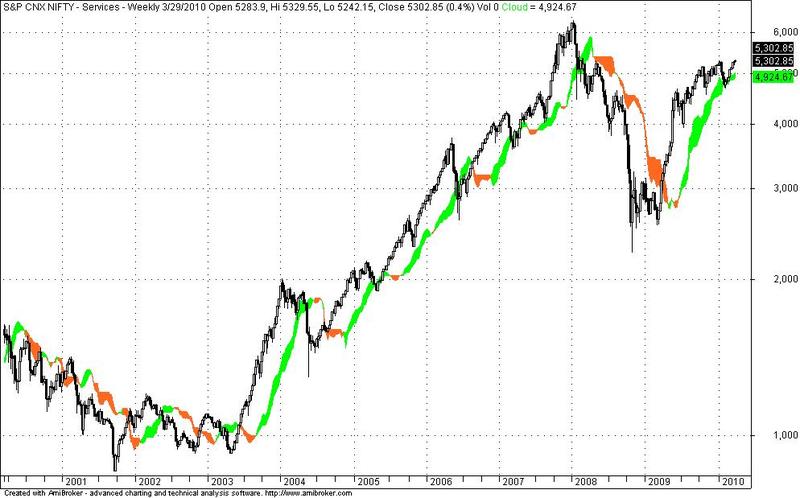
Simple AFL code for Ichimoku Cloud Charts are given here which plots only the Ichimoku cloud charts for any kind of timeframe. As usual Ichimoku performs a high role in high probability trading and this can be applied to any kind of time frame. The default parameter in this afl code is 3,13,16. And the cloud chart can be used as a trailing stop loss or your trades. If there is a upward breakout /downside breakdown then long/short positons need to be taken accordingly. Sample Nifty Weekly chart shown with 10 years of Ichimoku cloud chart. Check how it plays a major role in taking trend decisions. If you are a regular investor/trader in this market then you should keep eye on this fruitful strategy
This should be helpful for other members.
Screenshots
Indicator / Formula
_SECTION_BEGIN("Ichimoku Cloud Charts");
GraphXSpace =1;
prds = Param("Standard Line Periods?", 13,5,26,1);
prds1 = Param("Turning Line Periods?", 3,3,10,1);
prds2 = Param("Delayed Line Periods?", 12,4,25,1);
prds3 = Param("Spans Periods?", 16,10,52,1);
TL = ( HHV( H, prds1) + LLV( L, prds1) )/2;
SL = ( HHV( H, prds) + LLV( L, prds) )/2;
DL = Ref( C, prds2);
Sp1 = Ref( ( SL + TL )/2, -prds2);
Sp2 = Ref( (HHV( H, prds3) + LLV(L, prds3))/2, -prds2);
SetChartOptions( 0, chartShowDates | chartShowArrows | chartLogarithmic | chartWrapTitle );
_N( Title = StrFormat( "{{NAME}} - " + SectorID( 1 ) + " - {{INTERVAL}} {{DATE}} Open %g, Hi %g, Lo %g, Close %g (%.1f%%) Vol " + WriteVal( V, 1.0 ) + " {{VALUES}}", O, H, L, C, SelectedValue( ROC( C, 1 ) ) ) );
Plot( C, "Close", colorBlack, styleCandle | styleNoTitle | ParamStyle( "Style" ) | GetPriceStyle() );
if ( ParamToggle( "Tooltip shows", "All Values|Only Prices" ) )
{
ToolTip = StrFormat( "Open: %g\nHigh: %g\nLow: %g\nClose: %g (%.1f%%)\nVolume: " + NumToStr( V, 1 ), O, H, L, C, SelectedValue( ROC( C, 1 ) ) );
}
PlotOHLC (Sp1,Sp1,Sp2,Sp2,"Cloud",IIf(Sp1>Sp2,ParamColor("Span1 Color", ColorRGB(0,255,0)),ParamColor("Span2 Color",ColorRGB(255,104,32))),styleCloud);
_SECTION_END();
0 comments
Leave Comment
Please login here to leave a comment.