Kolkata for Amibroker (AFL)
vmbhat about 16 years ago Amibroker (AFL)
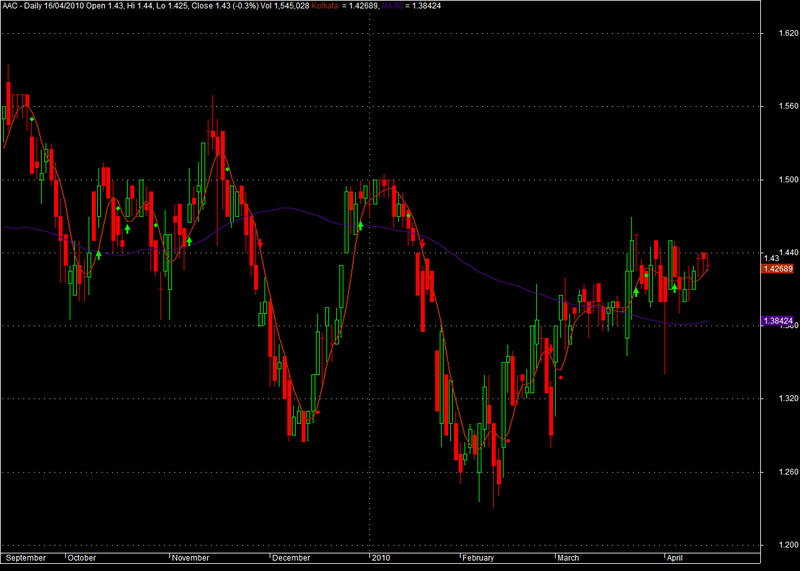
This will give buy sell signals but not checked
Screenshots
Indicator / Formula
Copy & Paste Friendly
 _SECTION_BEGIN("Live01");
////////////////////////////////////////////////////////////////////////////////////
// Global variables
GraphXSpace=10;
SetBarsRequired(10000,10000);

lperiod = Param("Long Period", 90,3,200,1);
P = ParamField("Price field",4);

a = Param("Angle",30,15,45,1);
a = (22/7)*(a/180);
Num = sin(1*a) * P + sin(2*a) * Ref(P,-1) + sin(3*a) * Ref(P,-2) + sin(4*a) * Ref(P,-3) + sin(5*a) * Ref(P,-4);
Den = sin(a) + sin(2*a) + sin (3*a) + sin(4*a) + sin(5*a);
kolkata = Num / Den;

movAvg = MA(P,lperiod);


////////////////////////////////////////////////////////////////////////////////////
// Desicion
Buy = kolkata > movAvg AND kolkata < L AND kolkata > movAvg;
Sell = kolkata < movAvg OR H < kolkata;
Short = movAvg > kolkata AND kolkata > H AND kolkata < movAvg;
Cover = kolkata > movAvg OR L > kolkata;

Buy = ExRem(Buy, Sell);
Sell = ExRem(Sell, Buy);
Short = ExRem(Short, Cover);
Cover = ExRem(Cover, Short);

////////////////////////////////////////////////////////////////////////////////////
// Graphics
Plot(kolkata, "Kolkata ", colorBrown, 5);
Plot(movAvg, "MA " + lperiod, colorIndigo, 5);

PlotShapes(IIf(Buy,shapeUpArrow,shapeNone),colorBrightGreen);
PlotShapes(IIf(Short,shapeDownArrow,shapeNone),colorRed);
PlotShapes(IIf(Sell,shapeSmallCircle,shapeNone),colorBrightGreen);
PlotShapes(IIf(Cover,shapeSmallCircle,shapeNone),colorRed);

_SECTION_END();
0 comments
Leave Comment
Please login here to leave a comment.