EMA Crossover Trading for Amibroker (AFL)
ratatat about 16 years ago Amibroker (AFL)
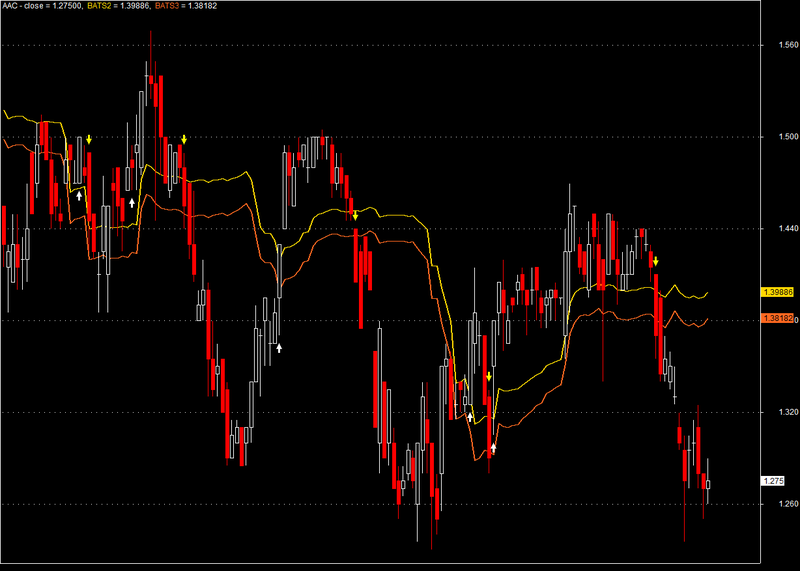
This is a simple Candle Stick Chart which plots buy & sell signals considering EMA crossover of price. It also has got an stop line plotted.
Screenshots
Indicator / Formula
Copy & Paste Friendly
_SECTION_BEGIN("Kandle");


Plot(C,"close",IIf(O>C,colorRed,colorWhite),styleCandle);


_SECTION_END();


_SECTION_BEGIN("Stops");
//Concept from Bulkowski’s Stop Placement.For further details go to http://thepatternsite.com/stops.html.
//First coded by Southwind from chartistsbd.net
//Modified by Rais.


pr=Param("Period",22,2,100,1);

Sumdif=0;
dif=0;
for(i=0;i<pr;i++)
{
dif=Ref(High,-i)-Ref(Low,-i);
Sumdif=Sumdif+dif;
}

Sumdif=Sumdif/pr;

mp = Param("Multiplier",2,0.25,5,0.25);
Sumdifml=(Sumdif*1);
Sumdifml2=(Sumdif*1.5);
Sumdifml3=(Sumdif*mp);

bt=Param("BETA Stop",22,2,100,1);

p=ParamField("Price Field",3);

Betastops=HHV(p,bt) - Sumdifml;
Betastops2=HHV(p,bt) - Sumdifml2;
Betastops3=HHV(p,bt) - Sumdifml3;


//Plot(Betastops, " BATS", ParamColor( "Color", colorYellow ),ParamStyle("Style",styleThick,maskAll));
Plot(Betastops2, " BATS2", ParamColor( "Color2", colorGold ),ParamStyle("Style2",styleThick,maskAll));
Plot(Betastops3, " BATS3", ParamColor( "Color3", colorOrange ),ParamStyle("Style3",styleThick,maskAll));


_SECTION_END();


_SECTION_BEGIN("expl-");


fastmalenght=9;
slowmalength=16;
fastma=EMA( C, fastmalenght );
slowma=EMA( C, slowmalength );

eBuy=Cross( fastma , slowma );

xbuy=ADX()>10;


eSell=Cross( slowma , fastma );
batsell=(Close<Betastops3 );


Buy=eBuy AND xbuy;
Sell = (esell) OR (batsell);


/* exrem is one method to remove surplus strade signals. It removes excessive signals of arrow */
Buy = ExRem(Buy, Sell);
Sell = ExRem(Sell, Buy);
ApplyStop(stopTypeLoss,stopModePercent,Optimize( "maX. loss stop level", 12, 2, 30, 1 ),True );
_SECTION_END();


_SECTION_BEGIN("Shape");

PlotShapes(IIf(Sell==1, shapeDownArrow, shapeNone), colorYellow, 0,High, Offset=-20);
PlotShapes(IIf(Buy==1, shapeUpArrow , shapeNone), colorWhite, 0,Low, Offset=-20);


_SECTION_END();
1 comments
Leave Comment
Please login here to leave a comment.
Good