Harmonic pattern detection for Amibroker (AFL)
Yaaad about 16 years ago Amibroker (AFL)
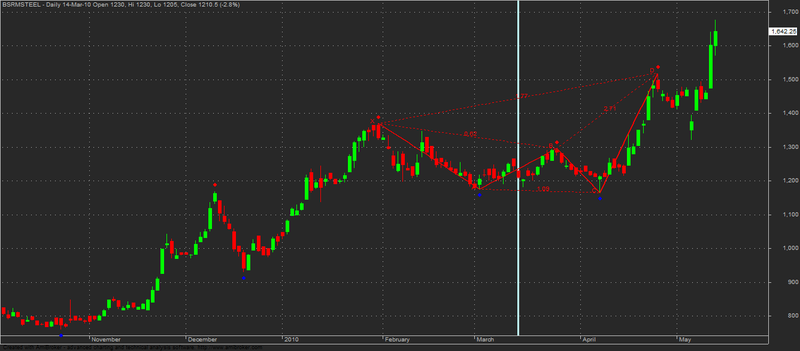
Some of the patterns are bearish and some of them are bullish which helps in taking decisions.
Screenshots
You cannot view the code for the following reasons:
- You must be a member.
17 comments
Leave Comment
Please login here to leave a comment.
Nice AFL – is there any to get the name of the pattern with bullish / bearish implications as text on the chart
Very nice!
I think those green+blue are BULL, those yellow+red are BEAR, consistent with text formula.
Sorry for putting a comment without cross checking – actually the name of the pattern appears on the day the pattern is completed – if you get the cursor on that day – Alternatively the exploration also gives names of scrips who have completed any of the patterns on the given day
I have to try this formula , Buy sell signal consists of 4 days after the late , dangerous
Thank you for sharing :)
Dear Kuzukapama
This indicator only provides early alert. For example if it is showing bearish pattern, even then rally may continue for 4-5 more days. For final decision you have to confirm it from other indicators like RSI or MACD.
Rakesh Kumar
Thanks for the explanation to ;)
Hi is there a way that we can color inside the shapes to make the pattern clearer.
Many thnks for sharing.
Mikey
WOW! I started using this pattern and I truly have learned to appreciate its power to detect precise BUY and SELL — almost to the dollar precise…
I, however, made mome minor adjustment to the code including but not limited to:
1. translation of the comments from vietnamese to english
2. buy/sell alerts
3. change coloring
Backtest I ran against this system were the most sucessfull backtest I had ever seen!!!
THANK YOU FOR THIS CODE!
~ yama ~
Hi,
Can any one pls say why I am not able to see the pattern drawing in amibroker while exploring? It shows scrip , volume, date and time but not pattern name and the plotting of the pattern in the chart? I am using ami 5.3. Pls help.
not working\
ON THURSDAY I SAW A BEARISH PATTERN COMPLETED DATE 13/3/04 SO I
THOUGH TO GO WITH SELL NEXT DAY BUT NEXT STOCK RALLY UPWARD AND THE SIGNAL WHICH HAD ALREADY COMPLETED ON 13/3/04 (THURSDAY) NOW SHIFT TO FRIDAY 14/3/04, IT MEANS THE ‘D’ WHICH ALREADY COMPLETED AND SHOWED ON 13/3/04 EOD CANDLE, AND NOW I AM SEEING IT MOVES TO 14/3/04 . PLZ MAKE IT CLEAR THAT HOW WOULD I KNOW WHEN EXACTLY THE PATTERN COMPLETED IT WONT GONA CHANGE WHATEVER THE CANDLE WOULD BE NEXT DAY OR DAY AFTER.
THANKYOU…..
fake formula with looking to the future with REF function …
it generate buy/sell signal by looking to the future which is completely useless
Many thnks for sharing.
This code for good
thank you very much .
very nice but I think this indicator is very help full but it does not mean we don’t think.
this is my opinion.
thanks again for sharing this indicator.
Can anyone revise the afl to indicate a potential pattern, i.e., before the completion of the pattern? What I mean is that if XA to B and AB to C ratios meet the requirements of a particular pattern, can the afl predict the price for point D. Copy-paste the URL to see the image.
http://imgur.com/a/9rfWK
Có comment tiếng Việt. Bạn Việt Nam viết AFL này à. Thanks