Butterfly Pattern for Amibroker (AFL)
asdaf1 over 16 years ago Amibroker (AFL)
معادلة التداول التوافقي
من ابو حسنين
What this says translated by google:
Trading the harmonic pattern
By Abu Hassanein
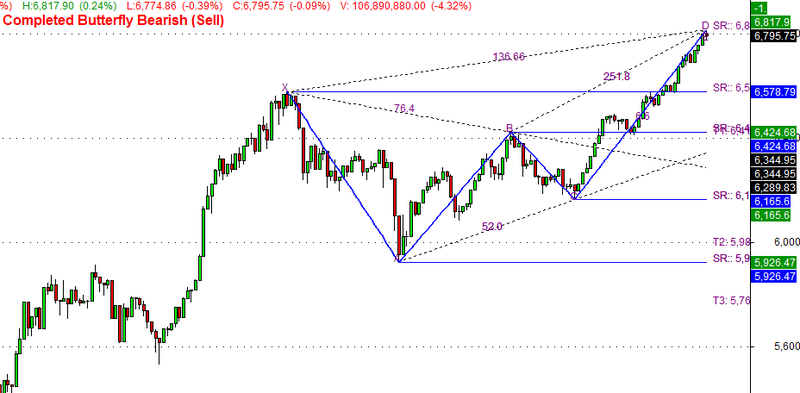
Screenshots
You cannot view the code for the following reasons:
- You must be a member and have contributed at least 1 indicator
56 comments
Leave Comment
Please login here to leave a comment.
Gives error message
Mahesh nobody can help you if you don’t provide details like error type, the line it occurred on and Amibroker version.
Dear Administrator – Sorry for the inconvenience
Message appears as follows
Butterfly:
SetOption(“Refreshwhencompleted,True”)
……………..^
Error 37
Unsupported field in set options
This error message is on Amibroker 5.1
Yes I am also getting the same message in 5.1 but in 5.2 version it is working fine.Also in 5.1 version for all the stocks rates are displayed from 0 onwards.Is there any way by which we can correct it to auto range.This problem is not faced in 5.2 version
Equation works to Amy Brooker 5.20
i’ll try it
Hello,
Is there a possible way to add arrows like Buy = TroughBars(EW, pr, 1) == 0;
Sell = PeakBars(EW, pr, 1) ==0;
Buy = ExRem(Buy, Sell);
Sell = ExRem(Sell, Buy);
PlotShapes( shapeUpArrow * Buy, colorGreen, 0, Low );
PlotShapes( shapeDownArrow * Sell, colorRed, 0, High );
at the peak and troughs for zig zag part of its indicator alog with X,A,B,CD
good formula
it shown syntax error plz rectify
Works fine I checked it. Please make sure your running a more recent version of Amibroker.
I have used this Formulla ,
I can say It is fantastic, Thanks a Million.
PLZ MODIFY THIS AFL FOR AMIBROKER 5.00. WE DONT KNOW HOW CHANGE,.
my amibroker version 5.20 will this work onit
SetOption(“RefreshWhenCompleted”, True );
sir, am face the above problem… am using AMI-5…pls try to solve…thx
dear admin ,
my amibroker version is 5.20 when applied this afl "no valid pattern or valid " is showing
pls slove the issue
غير موجود
thanks U
good
Thank you very much
very nice work
dear friend i am new user. my problem how to formula add in amibroker
how can i download
ok>>>>how can i download
I need to download it….. How can I do this?
thank lot very handy and useful specially for those often hesitate to sell at top
thank you admın
ok
tnx
Gives error message
ok ok
ok ok
thank you ..thank
Thanks
tnxx
ok ok
ok ok
OKOK
it shown syntax error plz rectify
Very good>>>>>>>>>>>>>>>>>>>.
gdd
GOOD BUT FORMULA ?//
good
Thank you very much good formula
good
Hello,
Is there a possible way to add arrows like
Buy = TroughBars(EW, pr, 1) == 0;at the peak and troughs for zig zag part of its indicator alog with X,A,B,CD
To Abu Hassanein
My gratitude
I really appreciate all of your hard work and effort in this formula
Thank you so much
Best regards.
Derek
Thank you very much for this formula Abu Hassanein!!!
hello we need the AFL
Hello,
Thank you very much for this formula
thank you about dounload it .
great
i can’t download this afl. I need it. Help me. Tks
i can’t download this afl. I need it. Help me. Tks
great