Good One Boss
Report as Spam
emonsyl about 16 years ago Amibroker (AFL)
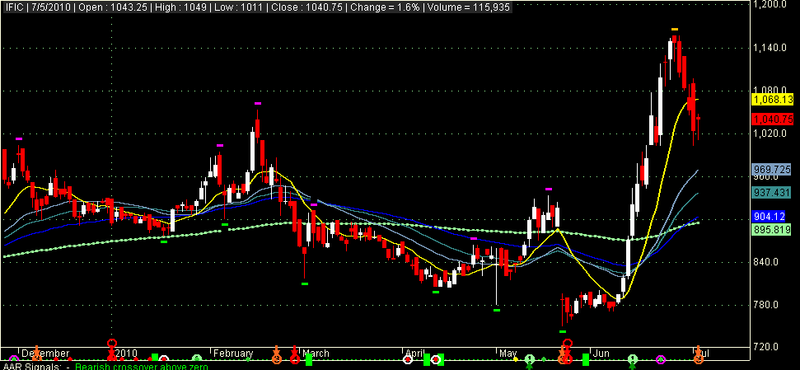
See the main chart. Fusion of multiple different indicators.
SetChartOptions(0,chartShowArrows|chartShowDates);

_SECTION_BEGIN("Background_Setting");
SetChartBkGradientFill( ParamColor("BgTop", colorBlack),

ParamColor("BgBottom", colorBlack),ParamColor("titleblock",colorDarkGrey ));
_SECTION_END();


_SECTION_BEGIN("Flower");

Plot (Close,"", IIf( C > O, ParamColor("Up Color", colorWhite ), ParamColor("Down Color", colorRed )),ParamStyle( "Style", styleCandle | styleThick, maskAll));
Title = StrFormat("\\c02 {{NAME}} | {{DATE}} | Open : %g | High : %g | Low : %g | Close : %g | Change = %.1f%% | Volume = " +WriteVal( V, 1.0 ) +" {{VALUES}}",O, H, L, C, SelectedValue( ROC( C, 1 )) );


_SECTION_END();


_SECTION_BEGIN("Average 1");
//Average_switch = ParamToggle("Candle On/off", "Off|On");
P = ParamField("Field");
Type = ParamList("Type", "Weighted,Lagless-21,Hull-26,Linear
Regression-45,Exponential,Double Exponential,Tripple
Exponential,Wilders,Simple");
Periods = Param("Periods", 15, 2, 200 );
Displacement = Param("Displacement", 1, -50, 50 );
m = 0;

if( Type == "Weighted" ) 				m=  WMA( P, Periods );
if( Type == "Lagless-21"  )				m=  2*EMA(P, Periods)-EMA(EMA(P, Periods),
Periods);
if( Type == "Hull-26"  )				m=  WMA(2*(WMA(P, Periods/2))-WMA(P, Periods) ,4
);
if( Type == "Linear Regression-45"  ) m=  LinearReg( P, Periods );
if( Type == "Exponential" ) 			m = EMA( P, Periods );
if( Type == "Double Exponential" ) 	m = DEMA( P, Periods );
if( Type == "Tripple Exponential" ) 	m = TEMA( P, Periods );
if( Type == "Wilders" ) 				m = Wilders( P, Periods );
if( Type == "Simple" ) 					m = MA( P, Periods );

Plot( m, _DEFAULT_NAME(), ParamColor("Color", colorYellow),ParamStyle("Style",styleLine |styleThick|styleNoTitle ,maskAll),Displacement );

_SECTION_END();

_SECTION_BEGIN("Average 2");
P = ParamField("Field");
Type = ParamList("Type", "Weighted,Lagless-21,Hull-26,Linear
Regression-45,Exponential,Double Exponential,Tripple
Exponential,Wilders,Simple");
Periods = Param("Periods", 35 ,2, 200 );
Displacement = Param("Displacement", 1, -50, 50 );
m = 0;

if( Type == "Weighted" ) 				m=  WMA( P, Periods );
if( Type == "Lagless-21"  )				m=  2*EMA(P, Periods)-EMA(EMA(P, Periods),
Periods);
if( Type == "Hull-26"  )				m=  WMA(2*(WMA(P, Periods/2))-WMA(P, Periods) ,4
);
if( Type == "Linear Regression-45"  ) m=  LinearReg( P, Periods );
if( Type == "Exponential" ) 			m = EMA( P, Periods );
if( Type == "Double Exponential" ) 	m = DEMA( P, Periods );
if( Type == "Tripple Exponential" ) 	m = TEMA( P, Periods );
if( Type == "Wilders" ) 				m = Wilders( P, Periods );
if( Type == "Simple" ) 					m = MA( P, Periods );

Plot( m, _DEFAULT_NAME(), ParamColor("Color", colorLightBlue),ParamStyle("Style",styleLine |styleThick|styleNoTitle ,maskAll),Displacement );
_SECTION_END();

_SECTION_BEGIN("Average 5");
P = ParamField("Field");
Type = ParamList("Type", "Weighted,Lagless-21,Hull-26,Linear
Regression-45,Exponential,Double Exponential,Tripple
Exponential,Wilders,Simple");
Periods = Param("Periods", 50 ,2, 200 );
Displacement = Param("Displacement", 1, -50, 50 );
m = 0;

if( Type == "Weighted" ) 				m=  WMA( P, Periods );
if( Type == "Lagless-21"  )				m=  2*EMA(P, Periods)-EMA(EMA(P, Periods),
Periods);
if( Type == "Hull-26"  )				m=  WMA(2*(WMA(P, Periods/2))-WMA(P, Periods) ,4
);
if( Type == "Linear Regression-45"  ) m=  LinearReg( P, Periods );
if( Type == "Exponential" ) 			m = EMA( P, Periods );
if( Type == "Double Exponential" ) 	m = DEMA( P, Periods );
if( Type == "Tripple Exponential" ) 	m = TEMA( P, Periods );
if( Type == "Wilders" ) 				m = Wilders( P, Periods );
if( Type == "Simple" ) 					m = MA( P, Periods );

Plot( m, _DEFAULT_NAME(), ParamColor("Color", colorTeal),ParamStyle("Style",styleLine |styleThick|styleNoTitle ,maskAll),Displacement );
_SECTION_END();


_SECTION_BEGIN("Sell Average 3");
P = ParamField("Field");
Type = ParamList("Type", "Weighted,Lagless-21,Hull-26,Linear
Regression-45,Exponential,Double Exponential,Tripple
Exponential,Wilders,Simple");
Periods = Param("Periods", 80, 2, 200 );
Displacement = Param("Displacement", 1, -50, 50 );
m = 0;

if( Type == "Weighted" ) 				m=  WMA( P, Periods );
if( Type == "Lagless-21"  )				m=  2*EMA(P, Periods)-EMA(EMA(P, Periods),
Periods);
if( Type == "Hull-26"  )				m=  WMA(2*(WMA(P, Periods/2))-WMA(P, Periods) ,4
);
if( Type == "Linear Regression-45"  ) m=  LinearReg( P, Periods );
if( Type == "Exponential" ) 			m = EMA( P, Periods );
if( Type == "Double Exponential" ) 	m = DEMA( P, Periods );
if( Type == "Tripple Exponential" ) 	m = TEMA( P, Periods );
if( Type == "Wilders" ) 				m = Wilders( P, Periods );
if( Type == "Simple" ) 					m = MA( P, Periods );

Plot( m, _DEFAULT_NAME(), ParamColor("Color", colorBlue),ParamStyle("Style",styleLine |styleThick|styleNoTitle ,maskAll),Displacement );
_SECTION_END();


_SECTION_BEGIN("Average 4");
P = ParamField("Field");
Type = ParamList("Type", "Weighted,Lagless-21,Hull-26,Linear
Regression-45,Exponential,Double Exponential,Tripple
Exponential,Wilders,Simple");
Periods = Param("Periods", 200, 2, 200 );
Displacement = Param("Displacement", 1, -50, 50 );
m = 0;

if( Type == "Weighted" ) 				m=  WMA( P, Periods );
if( Type == "Lagless-21"  )				m=  2*EMA(P, Periods)-EMA(EMA(P, Periods),
Periods);
if( Type == "Hull-26"  )				m=  WMA(2*(WMA(P, Periods/2))-WMA(P, Periods) ,4
);
if( Type == "Linear Regression-45"  ) m=  LinearReg( P, Periods );
if( Type == "Exponential" ) 			m = EMA( P, Periods );
if( Type == "Double Exponential" ) 	m = DEMA( P, Periods );
if( Type == "Tripple Exponential" ) 	m = TEMA( P, Periods );

Plot( m, _DEFAULT_NAME(), ParamColor("Color", colorPaleGreen),ParamStyle("Style",styleLine |styleThick|styleDots|styleNoTitle ,maskAll),Displacement );
_SECTION_END();

_SECTION_BEGIN("Pivot");
nBars = Param("Number of bars", 15, 5, 40);
LP=Param("LookBack Period",250,1,500,1);
bShowTCZ = Param("Show TCZ", 0, 0, 1);
nExploreBarIdx = 0;
nExploreDate = 0;
nCurDateNum = 0;
DN = DateNum();
DT = DateTime();
bTCZLong = False;
bTCZShort = False;
nAnchorPivIdx = 0;
ADX8 = ADX(8);
if(Status("action")==1) {
	bDraw = True;
	bUseLastVis = 1;
} else {
	bDraw = False;
	bUseLastVis = False;
	bTrace = 1;
	nExploreDate = Status("rangetodate");
	for (i=LastValue(BarIndex());i>=0;i--) {
		nCurDateNum = DN[i];
		if (nCurDateNum == nExploreDate) {
			nExploreBarIdx = i;
		}
	}
}
GraphXSpace=7;
if (bDraw) {
}
aHPivs = H - H;
aLPivs = L - L;
aHPivHighs = H - H;
aLPivLows = L - L;
aHPivIdxs = H - H;
aLPivIdxs = L - L;
aAddedHPivs = H - H;
aAddedLPivs = L - L;
aLegVol = H - H;
aRetrcVol = H - H;
nHPivs = 0;
nLPivs = 0;
lastHPIdx = 0;
lastLPIdx = 0;
lastHPH = 0;
lastLPL = 0;
curPivBarIdx = 0;
aHHVBars = HHVBars(H, nBars);
aLLVBars = LLVBars(L, nBars);
aHHV = HHV(H, nBars);
aLLV = LLV(L, nBars);
nLastVisBar = LastValue(
	Highest(IIf(Status("barvisible"), BarIndex(), 0)));
curBar = IIf(nlastVisBar > 0 AND bUseLastVis, nlastVisBar,
	IIf(Status("action")==4 AND nExploreBarIdx > 0, nExploreBarIdx,
	LastValue(BarIndex())));
curTrend = "";
if (aLLVBars[curBar] < aHHVBars[curBar])
	curTrend = "D";
else
	curTrend = "U";
if (curBar >= LP) {
	for (i=0; i<LP; i++) {
		curBar = IIf(nlastVisBar > 0 AND bUseLastVis,
			nlastVisBar-i,
			IIf(Status("action")==4 AND nExploreBarIdx > 0,
			nExploreBarIdx-i,
			LastValue(BarIndex())-i));
		if (aLLVBars[curBar] < aHHVBars[curBar]) {
			if (curTrend == "U") {
				curTrend = "D";
				curPivBarIdx = curBar - aLLVBars[curBar];
				aLPivs[curPivBarIdx] = 1;
				aLPivLows[nLPivs] = L[curPivBarIdx];
				aLPivIdxs[nLPivs] = curPivBarIdx;
				nLPivs++;
			}
		} else {
			if (curTrend == "D") {
				curTrend = "U";
				curPivBarIdx = curBar - aHHVBars[curBar];
				aHPivs[curPivBarIdx] = 1;
				aHPivHighs[nHPivs] = H[curPivBarIdx];
				aHPivIdxs[nHPivs] = curPivBarIdx;
				nHPivs++;
			}
		}
	}
}
curBar =
	IIf(nlastVisBar > 0 AND bUseLastVis,
	nlastVisBar,
	IIf(Status("action")==4 AND nExploreBarIdx > 0,
	nExploreBarIdx,
	LastValue(BarIndex()))
	);
if (nHPivs >= 2 AND nLPivs >= 2) {
	lastLPIdx = aLPivIdxs[0];
	lastLPL = aLPivLows[0];
	lastHPIdx = aHPivIdxs[0];
	lastHPH = aHPivHighs[0];
	nLastHOrLPivIdx = Max(lastLPIdx, lastHPIdx);
	nAddPivsRng = curBar - nLastHOrLPivIdx;
	aLLVAfterLastPiv = LLV(L, nAddPivsRng);
	nLLVAfterLastPiv = aLLVAfterLastPiv[curBar];
	aLLVIdxAfterLastPiv = LLVBars(L, nAddPivsRng);
	nLLVIdxAfterLastPiv = curBar - aLLVIdxAfterLastPiv[curBar];
	aHHVAfterLastPiv = HHV(H, nAddPivsRng);
	nHHVAfterLastPiv = aHHVAfterLastPiv[curBar];
	aHHVIdxAfterLastPiv = HHVBars(H, nAddPivsRng);
	nHHVIdxAfterLastPiv = curBar - aHHVIdxAfterLastPiv[curBar];
	if (lastHPIdx > lastLPIdx) {

		/*	There are at least two possibilities here. One is that
	   		the previous high was higher, indicating that this is a
	   		possible short retracement or one in the making.
	   		The other is that the previous high was lower, indicating
	   		that this is a possible long retracement in the working.
			However, both depend on opposing pivots. E.g., if I find
			higher highs, what if I have lower lows?

			If the highs are descending, then I can consider:
	   			- a lower low, and leave it at that
	   			- a higher high and higher low
	   			- a lower low and another lower high
		*/
		if (aHPivHighs[0] < aHPivHighs[1]) {

			if (nLLVAfterLastPiv < aLPivLows[0] AND
				(nLLVIdxAfterLastPiv - lastHPIdx - 1) >= 1
				AND nLLVIdxAfterLastPiv != curBar	) {

				// -- OK, we'll add this as a pivot.
				//    Mark it for plotting...
				aLPivs[nLLVIdxAfterLastPiv] = 1;
				aAddedLPivs[nLLVIdxAfterLastPiv] = 1;

				//    ...and then rearrange elements in the
				//    pivot information arrays
				for (j=0; j<nLPivs; j++) {
					aLPivLows[nLPivs-j] = aLPivLows[nLPivs-(j+1)];
					aLPivIdxs[nLPivs-j] = aLPivIdxs[nLPivs-(j+1)];
				}
				aLPivLows[0] = nLLVAfterLastPiv;
				aLPivIdxs[0] = nLLVIdxAfterLastPiv;
				nLPivs++;

			// -- Test whether to add piv given last piv is high
			//    AND we have lower highs
			}

		// -- Here, the last piv is a high piv, and we have
		//    higher-highs. The most likely addition is a
		//    Low piv that is a retracement.
		} else {

			if (nLLVAfterLastPiv > aLPivLows[0] AND
				(nLLVIdxAfterLastPiv - lastHPIdx - 1) >= 1
				AND nLLVIdxAfterLastPiv != curBar	) {

				// -- OK, we'll add this as a pivot.
				//    Mark it for plotting...
				aLPivs[nLLVIdxAfterLastPiv] = 1;
				aAddedLPivs[nLLVIdxAfterLastPiv] = 1;

				//    ...and then rearrange elements in the
				//    pivot information arrays
				for (j=0; j<nLPivs; j++) {
					aLPivLows[nLPivs-j] = aLPivLows[nLPivs-(j+1)];
					aLPivIdxs[nLPivs-j] = aLPivIdxs[nLPivs-(j+1)];
				}
				aLPivLows[0] = nLLVAfterLastPiv;
				aLPivIdxs[0] = nLLVIdxAfterLastPiv;
				nLPivs++;

			// -- Test whether to add piv given last piv is high
			//    AND we have lower highs
			}
		// -- The last piv is a high and we have higher highs
		//    OR lower highs
		}

	/* ****************************************************************
		Still finding missed pivot(s). Here, the last piv is a low piv.
	**************************************************************** */
	} else {

		// -- First case, lower highs
		if (aHPivHighs[0] < aHPivHighs[1]) {

			if (nHHVAfterLastPiv < aHPivHighs[0] AND
				(nHHVIdxAfterLastPiv - lastLPIdx - 1) >= 1
				AND nHHVIdxAfterLastPiv != curBar	) {

				// -- OK, we'll add this as a pivot.
				//    Mark that for plotting
				aHPivs[nHHVIdxAfterLastPiv] = 1;
				aAddedHPivs[nHHVIdxAfterLastPiv] = 1;

				//    ...and then rearrange elements in the
				//    pivot information arrays
				for (j=0; j<nHPivs; j++) {
					aHPivHighs[nHPivs-j] = aHPivHighs[nHPivs-(j+1)];
					aHPivIdxs[nHPivs-j] = aHPivIdxs[nhPivs-(j+1)];
				}
				aHPivHighs[0] = nHHVAfterLastPiv;
				aHPivIdxs[0] = nHHVIdxAfterLastPiv;
				nHPivs++;

			// -- Test whether to add piv given last piv is high
			//    AND we have lower highs
			}

		// -- Second case when last piv is a low piv, higher highs
		//    Most likely addition is high piv that is a retracement.
		//    Considering adding a high piv as long as it is higher
		} else {

			// -- Where I have higher highs,
			if (nHHVAfterLastPiv > aHPivHighs[0] AND
				(nHHVIdxAfterLastPiv - lastLPIdx - 1) >= 1
				AND nHHVIdxAfterLastPiv != curBar	) {

				// -- OK, we'll add this as a pivot.
				//    Mark it for plotting...
				aHPivs[nHHVIdxAfterLastPiv] = 1;
				aAddedHPivs[nHHVIdxAfterLastPiv] = 1;

				//    ...and then rearrange elements in the
				//    pivot information arrays
				for (j=0; j<nHPivs; j++) {
					aHPivHighs[nHPivs-j] = aHPivHighs[nHPivs-(j+1)];
					aHPivIdxs[nHPivs-j] = aHPivIdxs[nhPivs-(j+1)];
				}
				aHPivHighs[0] = nHHVAfterLastPiv;
				aHPivIdxs[0] = nHHVIdxAfterLastPiv;
				nHPivs++;

			// -- Test whether to add piv given last piv is high
			//    AND we have lower highs
			}

		}

	}

// -- If there are at least two of each
}

/* ****************************************
// -- Done with finding pivots
***************************************** */

if (bDraw) {

	// -- OK, let's plot the pivots using arrows


PlotShapes( IIf(aHPivs==1, shapeSmallSquare, shapeNone), colorCustom12, layer = 0, yposition = High, offset = 9);
PlotShapes( IIf(aHPivs==1, shapeSmallSquare, shapeNone), colorBlack, layer = 0, yposition = High, offset = 12);

PlotShapes( IIf(aAddedHPivs==1, shapeSmallSquare, shapeNone), colorCustom10,layer = 0, yposition = High, offset = 9);
PlotShapes( IIf(aAddedHPivs==1, shapeSmallSquare, shapeNone), colorBlack, layer = 0, yposition = High, offset = 12);

PlotShapes( IIf(aLPivs==1, shapeSmallSquare, shapeNone), colorBrightGreen, layer = 0, yposition = Low, offset = -9);
PlotShapes( IIf(aLPivs==1, shapeSmallSquare, shapeNone), colorBlack, layer = 0, yposition = Low, offset = -12);

PlotShapes( IIf(aAddedLPivs==1, shapeSmallSquare, shapeNone), colorYellow, layer = 0, yposition = Low, offset = -10);
PlotShapes( IIf(aAddedLPivs==1, shapeSmallSquare, shapeNone), colorBlack, layer = 0, yposition = Low, offset = -13);
}


/* ****************************************
// -- Done with discovering and plotting pivots
***************************************** */

// -- I'm going to want to look for possible retracement
risk = 0;
profInc = 0;
nLeg0Pts = 0;
nLeg0Bars = 0;
nLeg0Vol = 0;
nLeg1Pts = 0;
nLeg1Bars = 0;
nLeg1Vol = 0;
nLegBarsDiff = 0;
nRtrc0Pts = 0;
nRtrc0Bars = 0;
nRtrc0Vol = 0;
nRtrc1Pts = 0;
nRtrc1Bars = 0;
nRtrc1Vol = 0;

minRtrc = 0;
maxRtrc = 0;
minLine = 0;
maxLine = 0;
triggerLine = 0;
firstProfitLine = 0;
triggerInc = 0;
triggerPrc = 0;
firstProfitPrc = 0;
retrcPrc = 0;
retrcBar = 0;
retrcBarIdx = 0;
retrcRng = 0;
aRetrcPrc = H-H;
aRetrcPrcBars = H-H;
aRetrcClose = C;
retrcClose = 0;

// -- Do TCZ calcs. Arrangement of pivs very specific
//    for this setup.
if (nHPivs >= 2 AND
	nLPivs >=2 AND
	aHPivHighs[0] > aHPivHighs[1] AND
	aLPivLows[0] > aLPivLows[1]) {

	tcz500 =
	(aHPivHighs[0] -
	(.5 * (aHPivHighs[0] - aLPivLows[1])));

	tcz618 =
	(aHPivHighs[0] -
	(.618 * (aHPivHighs[0] - aLPivLows[1])));

	tcz786 =
	(aHPivHighs[0] -
	(.786 * (aHPivHighs[0] - aLPivLows[0])));

	retrcRng = curBar  - aHPivIdxs[0];
	aRetrcPrc = LLV(L, retrcRng);
	aRetrcPrcBars  = LLVBars(L, retrcRng);

	retrcPrc = aRetrcPrc[curBar];
	retrcBarIdx = curBar - aRetrcPrcBars[curBar];
	retrcClose = aRetrcClose[retrcBarIdx];

	// -- bTCZLong setup?
	bTCZLong = (

		// -- Are retracement levels arranged in
		//    tcz order?

		// .500 is above .786 for long setups
		tcz500 >= (tcz786 * (1 - .005))
		AND
		// .681 is below .786 for long setups
		tcz618 <= (tcz786 * (1 + .005))
		AND

		// -- Is the low in the tcz range
		// -- Is the close >= low of tcz range
		//    and low <= high of tcz range
		retrcClose >= ((1 - .01) *  tcz618)
		AND
		retrcPrc <= ((1 + .01) *  tcz500)
		);

		// -- risk would be high of signal bar minus low of zone
		//risk = 0;

// -- lower highs and lower lows
} else if (nHPivs >= 2 AND nLPivs >=2
	AND aHPivHighs[0] < aHPivHighs[1]
	AND aLPivLows[0] < aLPivLows[1]) {

	tcz500 =
	(aHPivHighs[1] -
	(.5 * (aHPivHighs[1] - aLPivLows[0])));

	tcz618 =
	(aHPivHighs[0] -
	(.618 * (aHPivHighs[1] - aLPivLows[0])));

	tcz786 =
	(aHPivHighs[0] -
	(.786 * (aHPivHighs[0] - aLPivLows[0])));

	retrcRng = curBar  - aLPivIdxs[0];
	aRetrcPrc = HHV(H, retrcRng);
	retrcPrc = aRetrcPrc[curBar];
	aRetrcPrcBars  = HHVBars(H, retrcRng);
	retrcBarIdx = curBar - aRetrcPrcBars[curBar];
	retrcClose = aRetrcClose[retrcBarIdx];

	bTCZShort = (
		// -- Are retracement levels arranged in
		//    tcz order?

		// .500 is below .786 for short setups
		tcz500 <= (tcz786 * (1 + .005))
		AND
		// .681 is above .786 for short setups
		tcz618 >= (tcz786 * (1 - .005))
		AND

		// -- Is the close <= high of tcz range
		//    and high >= low of tcz range
		retrcClose <= ((1 + .01) *  tcz618)
		AND
		retrcPrc >= ((1 - .01) *  tcz500)
		);

		// -- Risk would be top of zone - low of signal bar
		//risk = 0;
}

// -- Show zone if present
if (bTCZShort OR bTCZLong) {

	// -- Be prepared to see symmetry
	if (bTCZShort) {
		if (aLPivIdxs[0] > aHPivIdxs[0]) {
			// -- Valuable, useful symmetry information
			nRtrc0Pts = aHPivHighs[0] - aLPivLows[1];
			nRtrc0Bars = aHPivIdxs[0] - aLPivIdxs[1] + 1;
			nRtrc1Pts = retrcPrc - aLPivLows[0];
			nRtrc1Bars = retrcBarIdx - aLPivIdxs[0] + 1;
		} else {
			nRtrc0Pts = aHPivHighs[1] - aLPivLows[1];
			nRtrc0Bars = aHPivIdxs[1] - aLPivIdxs[1] + 1;
			nRtrc1Pts = aHPivHighs[0] - aLPivLows[0];
			nRtrc1Bars = aHPivIdxs[0] - aLPivIdxs[0] + 1;
		}
	} else { // bLongSetup
		if (aLPivIdxs[0] > aHPivIdxs[0]) {
			nRtrc0Pts = aHPivHighs[0] - aLPivLows[1];
			nRtrc0Bars = aHPivIdxs[0] - aLPivIdxs[1] + 1;
			nRtrc1Pts = retrcPrc - aLPivLows[0];
			nRtrc1Bars = retrcBarIdx - aLPivIdxs[0] + 1;
		} else {
			nRtrc0Pts = aHPivHighs[1] - aLPivLows[0];
			nRtrc0Bars = aLPivIdxs[0] - aHPivIdxs[1] + 1;
			nRtrc1Pts = aHPivHighs[0] - aLPivLows[0];
			nRtrc1Bars = aLPivIdxs[0] - aHPivIdxs[0] + 1;
		}
	}

	if (bShowTCZ) {
		Plot(
			LineArray(	IIf(bTCZLong, aHPivIdxs[0], aLPivIdxs[0]),
			tcz500, curBar, tcz500 , 0),
			"tcz500", colorPaleBlue, styleLine);
		Plot(
			LineArray(	IIf(bTCZLong, aHPivIdxs[0], aLPivIdxs[0]),
			tcz618, curBar, tcz618, 0),
			"tcz618", colorPaleBlue, styleLine);
		Plot(
			LineArray(	IIf(bTCZLong, aHPivIdxs[0], aLPivIdxs[0]),
			tcz786, curBar, tcz786, 0),
			"tcz786", colorTurquoise, styleLine);
	}

// -- if (bShowTCZ)
}


// **************************
// END INDICATOR CODE
// **************************
_SECTION_END();Please login here to leave a comment.