Camarilla Pivot lines for Amibroker (AFL)
sid.2009.in over 16 years ago Amibroker (AFL)
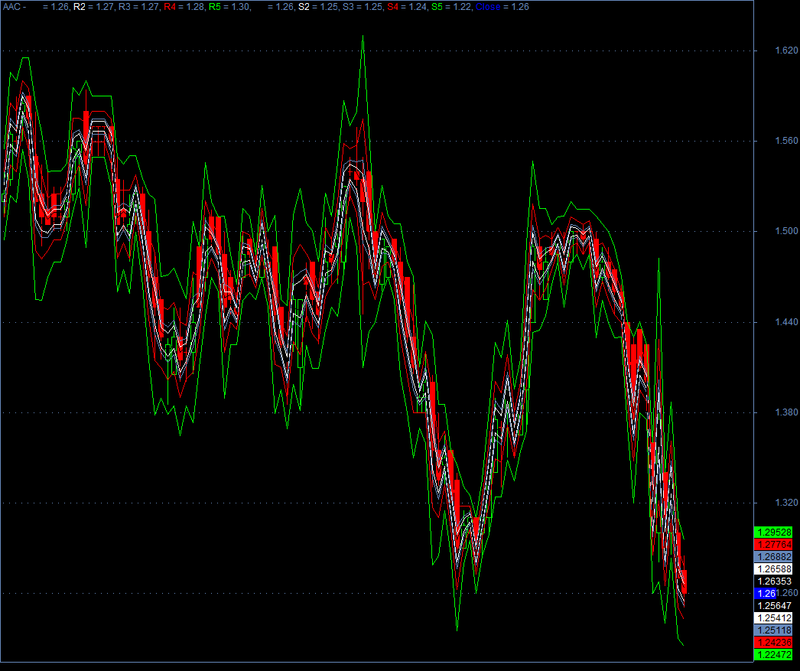
CAMARILLA Pivot lines
Screenshots
Indicator / Formula
Copy & Paste Friendly
P1=Param("P1",1,0.00,2,0.01);

TimeFrameSet( inDaily );

R5 = (H/L)*C;

R4 = (((H/L)+P1)/(1+P1))*C;

R3 = (((H/L)+(1+2*P1))/(2+2*P1))*C;

R2 = (((H/L)+(1+4*P1))/(2+4*P1))*C;

R1 = (((H/L)+(1+8*P1))/(2+8*P1))*C;

S5 = C - (R5-C);

S4 = C - (R4-C);

S3 = C - (R3-C);

S2 = C - (R2-C);

S1 = C - (R1-C);

TimeFrameRestore(); // restore time frame to original

Plot(TimeFrameExpand(R1, inDaily),"R1",1,1);

Plot(TimeFrameExpand(R2, inDaily),"R2",2,1);

Plot(TimeFrameExpand(R3, inDaily),"R3",3,1);

Plot(TimeFrameExpand(R4, inDaily),"R4",4,1);

Plot(TimeFrameExpand(R5, inDaily),"R5",5,1);

Plot(TimeFrameExpand(S1, inDaily),"S1",1,1);

Plot(TimeFrameExpand(S2, inDaily),"S2",2,1);

Plot(TimeFrameExpand(S3, inDaily),"S3",3,1);

Plot(TimeFrameExpand(S4, inDaily),"S4",4,1);

Plot(TimeFrameExpand(S5, inDaily),"S5",5,1);

Plot(Close,"Close",colorBlue,styleCandle,styleThick);
if( ParamToggle("Tooltip shows", "All Values|Only Prices" ) )
{
 ToolTip=StrFormat("Open: %g\nHigh:  %g\nLow:   %g\nClose:  %g (%.1f%%)\nVolume: "+NumToStr( V, 1 ), O, H, L, C, SelectedValue( ROC( C, 1 )));
}
2 comments
Leave Comment
Please login here to leave a comment.
I am trying to recreate this formula in excel. But I am confused about the P1 parameter. How can I interpret it?
Hi Praveen,
Plz refer this
http://www.wisestocktrader.com/indicators/525-camarilla-pivot