Stock Portfolio Organizer
The ultimate porfolio management solution.
WiseTrader Toolbox
#1 Selling Amibroker Plugin featuring:
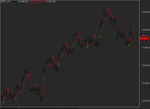
ATR-based trailing stop for Amibroker (AFL)
trailing stop with ATR-based trailing stop.
It allows to use both fixed percentage AND ATR-based “Chandelier” stop.
Screenshots
Similar Indicators / Formulas
Indicator / Formula
Version(5.20); // requires v5.20
SetBarsRequired(sbrAll);

// get start date
Start = Cross( DateNum(), ParamDate("Start date", "2010-01-01" ) );
Started = Flip( Start, 0 );

StopMode = ParamToggle("Stop Mode", "Fixed|Chandelier" );
StopLevel = Param("Fixed perc %", 14, 0.1, 50, 0.1)/100;
StopATRFactor = Param("Chandelier ATR multiple", 4, 0.5, 10, 0.1 );
StopATRPeriod = Param("Chandelier ATR period", 14, 3, 50 );

// calculate support and resistance levels
if( StopMode == 0 ) // fixed percent trailing stop
{
 sup = C * ( 1 - stoplevel );
 res = C * ( 1 + stoplevel );
}
else // Chandelier ATR-based stop
{
 sup = C - StopATRFactor * ATR( StopATRPeriod );
 res = C + StopATRFactor * ATR( StopATRPeriod );
}

// calculate trailing stop line
trailARRAY = Null;
trailstop = 0;
for( i = 1; i < BarCount; i++ )
{
if( Started[ i ] == 0 ) continue;

if( C[ i ] > trailstop AND C[ i - 1 ] > trailstop )
   trailstop = Max( trailstop, sup[ i ] );
else
if( C[ i ] < trailstop AND C[ i - 1 ] < trailstop )
   trailstop = Min( trailstop, res[ i ] );
else
   trailstop = IIf( C[ i ] > trailstop, sup[ i ], res[ i ] );

trailARRAY[ i ] = trailstop;
}

// generate buy/sell signals based on crossover with trail stop line
Buy = Start OR Cross( C, trailArray );
Sell = Cross( trailArray, C );

PlotShapes(Buy*shapeUpArrow,colorGreen,0,trailarray);
PlotShapes(Sell*shapeDownArrow,colorRed,0,trailarray);

Plot( Close,"Price",colorBlack,styleBar);
Plot( trailARRAY,"trailing stop level", colorRed );
7 comments
Leave Comment
Please login here to leave a comment.
Back
The indicator is just displaying plain bar chart and nothing else. I am using amibroker 5.3.
Hello godisbogus ,
This image is also of AB 5.30
check parameter window…you should have data from 01-01-2010 …if not then change date from parameter window
Thank you
Hi,
Just found this interesting formula and trying to experiment.
My coding not strong and when trying to change the start date parameter, it seemed to change ok but back test results did not change. Also changed startdate manually in code line for ‘start’ but no effect.
Maybe stopATRPeriod is involved??
Thanks for your help in advance.
Regards, Doedau.
Hi,
Works fine with lower versions also.
Try this,
Block the following lines in the code.
//Version(5.20); // requires v5.20
//SetBarsRequired(sbrAll);
This is essentially the same code that was published in Stocks and Commodities and on the AmiBroker website. The only thing that this code does is eliminate two other stops that in the original: fixed percent and modified-Chanelier.
Is there any update on this AFL?
Only Barchart are shown, ATR Trailing lines with triangle shapes are not shown.
Update please, I love this afl but can’t use in amibroker 6. Blank in the chart called null for atr.