South Breeze for Amibroker (AFL)
ashraf samir almost 16 years ago Amibroker (AFL)
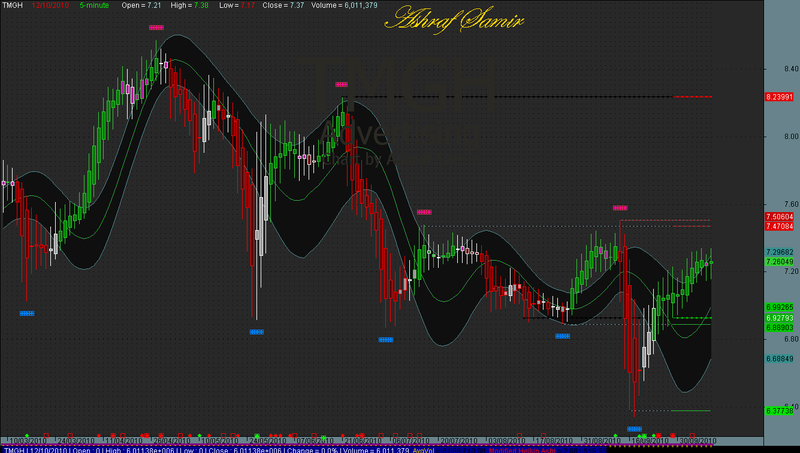
Good afl with good accuracy in buy sale signal. Requires the foundation plugin from here to run. Installation instruction can be found in the comments of that link.
Screenshots
Indicator / Formula
Copy & Paste Friendly
_SECTION_BEGIN("Chart Settings");
	SetChartOptions(0,chartShowArrows|chartShowDates);
	SetChartBkColor(ParamColor("Outer Panel",colorPaleBlue));
	SetChartBkGradientFill(ParamColor("Upper Chart",colorDarkGrey),ParamColor("Lower Chart",colorDarkGrey));
	GraphXSpace=Param("GraphXSpace",10,0,100,1);
	dec = (Param("Decimals",2,0,7,1)/10)+1;
	bi = BarIndex();
	Lbi = LastValue(BarIndex());
	sbi = SelectedValue(bi);
	x1= BarCount-1;
Title = EncodeColor(55)+  Title = Name() + "     " + EncodeColor(32) + Date() +
"      " + EncodeColor(5) + "{{INTERVAL}}  " +
	EncodeColor(55)+ "     Open = "+ EncodeColor(52)+ WriteVal(O,dec) +
	EncodeColor(55)+ "     High = "+ EncodeColor(5) + WriteVal(H,dec) +
	EncodeColor(55)+ "      Low = "+ EncodeColor(32)+ WriteVal(L,dec) +
	EncodeColor(55)+ "    Close = "+ EncodeColor(52)+ WriteVal(C,dec)+
	EncodeColor(55)+ "    Volume = "+ EncodeColor(52)+ WriteVal(V,1);
_SECTION_END();
//========================================================================


SetChartOptions(2,chartShowArrows|chartShowDates|chartWrapTitle);
SetChartOptions(0,chartShowArrows|chartShowDates);


//GfxGradientRect( 180, 30, 1759, 735, ColorRGB(40,40,40), ColorRGB(0,0,40) );
GfxSetOverlayMode(1);
//GfxSelectPen( ColorRGB(150,0,0), 1 );
GfxSelectSolidBrush( ColorRGB(0,0,40) );
//GfxRectangle=( 0,750, 1807, 35 );

//GfxSelectPen( ColorRGB(150,0,0), 2 );
GfxSelectSolidBrush( ColorRGB(65,65,65) );
//GfxPolygon(250,200,200,250,250,20,200,50);

//GfxSelectPen( ColorRGB(125,0,0), 1 );
//GfxSelectSolidBrush( ColorRGB(0,0,40) );
//GfxRectangle( 10,100, 190, 160 );

//GfxSelectPen=( ColorRGB(0,0,0) ,1 );
GfxSelectSolidBrush( ColorRGB(0,0,0) );
//GfxSetTextAlign( 250 );// center alignment

GfxSetOverlayMode(1);
//GfxSelectFont=("Times New Roman", 30, 400, True );
GfxSetTextColor( ColorRGB( 105, 105, 105 ) );
GfxSetBkMode(0); // transparent
//GfxTextOut=("Pathfinder", 15 , 35 );


_SECTION_BEGIN("Flower");
si=Param("Zoom/In Out",5,-50,100,1);
GraphXSpace=si;

r1 = Param( "ColorFast avg", 5, 2, 200, 1 );
r2 = Param( "ColorSlow avg", 10, 2, 200, 1 );
r3 = Param( "ColorSignal avg", 5, 2, 200, 1 );

m1=MACD(r1,r2);
s1=Signal(r1,r2,r3);
mycolor=IIf(m1<0 AND m1>s1, ColorRGB(155,155,155),IIf(m1>0 AND m1>s1,ColorRGB(0,125,0),IIf(m1>0 AND m1<s1,ColorRGB(180,30,160),ColorRGB(100,0,0))));

Prd1=Param("ATR Period",4,1,20,1);
Prd2=Param("Look Back",7,1,20,1);
green = HHV(LLV(L,Prd1)+ATR(Prd1),Prd2);
red = LLV(HHV(H,Prd1)-ATR(Prd1),Prd2);
flowerClose = EMA((Open+High+Low+Close)/4,3) ;
flowerOpen = EMA((Ref(Open,-1) + Ref(flowerClose,-1))/2,3);
Temp = Max(High, flowerOpen);
flowerHigh = EMA(Max(Temp, flowerClose),3);
Temp = Min(Low,flowerOpen);
flowerLow = EMA(Min(Temp, flowerClose),3);
barColor=IIf(Close>Open,ColorRGB(0,245,0),ColorRGB(255,0,0));

Ctmpl = E_TSKPCOLORTMPL(Open,High,Low,Close,Volume);
total = 0;
total = total  + IIf(tskp_colortmplcnd0 > 0, 1, -1);
total = total  + IIf(tskp_colortmplcnd1 > 0, 1, -1);
total = total  + IIf(tskp_colortmplcnd2 > 0, 1, -1);
total = total  + IIf(tskp_colortmplcnd3 > 0, 1, -1);
total = total  + IIf(tskp_colortmplcnd4 > 0, 1, -1);
total = total  + IIf(tskp_colortmplcnd5 > 0, 1, -1);
total = total  + IIf(tskp_colortmplcnd6 > 0, 1, -1);
total = total  + IIf(tskp_colortmplcnd7 > 0, 1, -1);
total = total  + IIf(tskp_colortmplcnd8 > 0, 1, -1);


for( i = 0; i < BarCount; i++ )
{

	if( total[i] >= 5 )
		Color[i] = colorLime;
	else if(  total[i] <= -5 )
		Color[i] = colorRed;
	else
		Color[i] = colorWhite;
}

Candle=ParamList("Candle","Modified Candlestick,Modified Heikin Ashi,Normal Candlestick",1);
if(Candle=="Modified Candlestick")
{
ColorHighliter = myColor;
SetBarFillColor( ColorHighliter );
Plot (Close,"- Modified Candlestick", Color,ParamStyle( "Style", styleCandle|styleLine | styleThick, maskAll));
}
if(Candle=="Modified Heikin Ashi")
{
ColorHighliter = myColor;
SetBarFillColor( ColorHighliter );
PlotOHLC( IIf(flowerOpen<flowerClose, flowerOpen, flowerClose),flowerHigh,flowerLow,IIf(flowerOpen<flowerClose, flowerClose, flowerOpen), "Modified Heikin Ashi", Color, styleCandle|styleLine);
}
if(Candle=="Normal Candlestick")
{
//ColorHighliter = myColor;
//SetBarFillColor( ColorHighliter );
PlotOHLC(O,H,L,C,"Normal Candlestick",barcolor,styleCandle|styleLine);
}


_SECTION_END();

_SECTION_BEGIN("TSKPPIVOT");

if(Candle=="Modified Heikin Ashi")
{
CHiPr = 0;
CLoPr = 9999999;
blsLong = 0;
PrevCOBar = 0;
NumBars = 0;
PrePP = 0;
PrevLowVal = 9999999;
BuySig = 0;
blsShort = 0;
PrevHiVal = 0;
blsNewCO = 0;
BarDif   = 0;

KPA900Val = E_TSKPA900(Close);
KPAutoStopVal = E_TSKPAUTOSTOP(High,Low,Close);

// -- Create 0-initialized arrays the size of barcount
aHPivs = flowerHigh - flowerHigh;
aLPivs = flowerLow - flowerLow;
aHiVal = flowerHigh - flowerHigh;
aLoVal = flowerLow - flowerLow;


Ctmpl = E_TSKPCOLORTMPL(Open,High,Low,Close,Volume);
sctotal = 0;
sctotal = sctotal  + IIf(tskp_colortmplcnd0 > 0, 1, -1);
sctotal = sctotal  + IIf(tskp_colortmplcnd1 > 0, 1, -1);
sctotal = sctotal  + IIf(tskp_colortmplcnd2 > 0, 1, -1);
sctotal = sctotal  + IIf(tskp_colortmplcnd3 > 0, 1, -1);
sctotal = sctotal  + IIf(tskp_colortmplcnd4 > 0, 1, -1);
sctotal = sctotal  + IIf(tskp_colortmplcnd5 > 0, 1, -1);
sctotal = sctotal  + IIf(tskp_colortmplcnd6 > 0, 1, -1);
sctotal = sctotal  + IIf(tskp_colortmplcnd7 > 0, 1, -1);
sctotal = sctotal  + IIf(tskp_colortmplcnd8 > 0, 1, -1);


for (curBar=0; curBar < BarCount-1; curBar++)
{

	if ( curBar == 0 )
	{
		CHiPr = flowerHigh[curBar];
		CHiBar = curBar;
		CLoPr = flowerLow[curBar];
		CLoBar = curBar;
		blsLong = 0;
		blsShort = 0;
		blsNewCO = 0;
		PrePP = 0;
		PrevCOBar = 0;
		PrevHiVal = flowerHigh[curBar];
		PrevLowVal = flowerLow[curBar];
		BuySig = 0;
		SellSig = 0;
		blsLL  = 0;
	}

	if (flowerHigh[CurBar] >= CHiPr) {
		CHiPr = flowerHigh[CurBar];
		ChiBar = CurBar;
	}

	if (flowerLow[CurBar] <= CLoPr) {
		CLoPr = flowerLow[CurBar];
		CLoBar = CurBar;
	}

	if ( (KPA900Val[curBar] >= KPAutoStopVal[curbar]) AND (PrePP != -1) AND (blsLong != 1) ){
		BarDif = CurBar - PrevCOBar;
		if (BarDif >= NumBars) {
			blsLong = 1;
			blsShort = 0;
			blsNewCO = 1;
			PrevCOBar = CurBar;
		}
	}

	if ( (KPA900Val[curBar] <= KPAutoStopVal[curbar]) AND (PrePP != 1) AND (blsShort != 1) ){
		BarDif = CurBar - PrevCOBar;
		if (BarDif >= NumBars) {
			blsLong = 0;
			blsShort = 1;
			blsNewCO = 1;
			PrevCOBar = CurBar;
		}
	}

	if ( (blsNewCO == 1) AND (sctotal[CurBar] >= 5) AND (blsLong == 1) ) {
		LVal = CurBar - CLoBar;
		for (j= CLoBar-1; j <= CLoBar+1; j++)
		{
			if (j >=0) {
				aLPivs[j] = 1;
				aLoVal[j] = CLoPr;
			}
		}
		PrePP = -1;
		blsNewCO = 0;
		CHiPr = flowerHigh[CurBar];
		CHiBar = CurBar;
		CLoPr = flowerLow[Curbar];
		CLoBar = CurBar;
		}
		else if ((blsNewCO == 1) AND (sctotal[CurBar] <= -5) AND (blsShort == 1) ) {
		HVal = CurBar - CHiBar;
		for (j= CHiBar-1; j <= CHiBar+1; j++)
		{
			if (j >=0) {
				aHPivs[j] = 1;
				aHiVal[j] = CHiPr;
			}
		}
		PrePP = 1;
		blsNewCO = 0;
		CHiPr = flowerHigh[CurBar];
		CHiBar = CurBar;
		CLoPr = flowerLow[Curbar];
		CLoBar = CurBar;
		}
}

PlotShapes(IIf(aHPivs == 1, 21,shapeNone), ColorRGB(255,0,145),0,   aHiVal,Offset = 20);
PlotShapes(IIf(aHPivs == 1, 15,shapeNone), ColorRGB(200,50,75),0,   aHiVal,Offset = 20);
PlotShapes(IIf(aLPivs == 1, 21,shapeNone), ColorRGB(0,125,225),0, aLoVal, Offset = -20);
PlotShapes(IIf(aLPivs == 1, 15,shapeNone), ColorRGB(0,125,255),0, aLoVal, Offset = -20);
}


_SECTION_END();

_SECTION_BEGIN("Resistance");
supres=ParamToggle("Sup_Res","No|Yes",1);
if(supres)
{

Prd1=Param("Res_Period1",2,0,200,1);

test   = TEMA  ( High , Prd1 ) ;

PK = test > Ref(test,-1) AND Ref(test,1) < High;//Peak
PKV0 = ValueWhen(PK,flowerHigh,0);//PeakValue0
PKV1 = ValueWhen(PK,flowerHigh,1);//PeakValue1
PKV2 = ValueWhen(PK,flowerHigh,2);//PeakValue2

MPK = PKV2 < PKV1 AND PKV1 > PKV0 ;//MajorPeak

RsColor=ParamColor("ResistColor",ColorRGB(225,0,0));
BrCount=Param("ResistBarLength",8,1,500,1);
for (i=0;i<BarCount-BrCount;i++) //hide the line except most recent 10 bars
{
	RsColor[i] = colorBlack;
}


MPKV = ValueWhen(Ref(MPK,-1) == 0 AND MPK == 1, PKV1,1); //MajorPeakValue
MPKD = ValueWhen(Ref(MPK,-1) == 0 AND MPK == 1, DateNum(),1); //MajorPeakDate
SD = IIf(DateNum() < LastValue(MPKD,lastmode = True ), Null, LastValue(MPKV,Lastmode = True));//SelectedDate
Plot(SD, "Resist1",  ColorRGB(200,0,0),ParamStyle("ResStyle1",styleDashed|styleNoTitle,maskAll));

RsColor2=ParamColor("Resist2Color",ColorRGB(225,0,0));
BrCount=Param("Resist2BarLength",8,1,500,1);
for (i=0;i<BarCount-BrCount;i++) //hide the line except most recent 10 bars
{
	RsColor2[i] = colorBlack;
}

MPKV2 = ValueWhen(Ref(MPK,-1) == 0 AND MPK == 1, PKV1,2); //MajorPeakValue
MPKD2 = ValueWhen(Ref(MPK,-1) == 0 AND MPK == 1, DateNum(),2); //MajorPeakDate
SD2 = IIf(DateNum() < LastValue(MPKD2,lastmode = True ), Null, LastValue(MPKV2,Lastmode = True));//SelectedDate
Plot(SD2, "Resist2", RsColor2,ParamStyle("ResStyle2",styleDashed|styleNoTitle,maskAll));

RsColor3=ParamColor("Resist3Color",ColorRGB(225,0,0));
BrCount=Param("Resist3BarLength",8,1,500,1);
for (i=0;i<BarCount-BrCount;i++) //hide the line except most recent 10 bars
{
	RsColor3[i] = colorBlack;
}


MPKV3 = ValueWhen(Ref(MPK,-1) == 0 AND MPK == 1, PKV1,3); //MajorPeakValue
MPKD3 = ValueWhen(Ref(MPK,-1) == 0 AND MPK == 1, DateNum(),3); //MajorPeakDate
SD3 = IIf(DateNum() < LastValue(MPKD3,lastmode = True ), Null, LastValue(MPKV3,Lastmode = True));//SelectedDate
Plot(SD3, "Resist3", RsColor3,ParamStyle("ResStyle3",styleThick|styleDots|styleNoTitle,maskAll));


_SECTION_END();


_SECTION_BEGIN("Support");

Prd2=Param("Sup_Period1",2,0,200,1);

test2   = TEMA ( Low , Prd2 ) ;

SP = Ref(test2,1) > Low AND test2 < Ref(test2,-1);//Peak
SPV0 = ValueWhen(SP,flowerLow,0);//PeakValue0
SPV1 = ValueWhen(SP,flowerLow,1);//PeakValue1
SPV2 = ValueWhen(SP,flowerLow,2);//PeakValue2

MSP = SPV2 > SPV1 AND SPV1 < SPV0 ;//MajorPeak

SpColor=ParamColor("SupColor",ColorRGB(0,225,0));
BrCount=Param("SupBarLength",8,1,500,1);
for (i=0;i<BarCount-BrCount;i++) //hide the line except most recent 10 bars
{
	SpColor[i] = colorBlack;
}


MSPV = ValueWhen(Ref(MSP,-1) == 0 AND MSP == 1, SPV1,1);
MSPD = ValueWhen(Ref(MSP,-1) == 0 AND MSP == 1, DateNum(),1);
SD = IIf(DateNum() < LastValue(MSPD,lastmode = True ), Null, LastValue(MSPV,Lastmode = True));
Plot(SD,"Support1",SpColor,ParamStyle("SupportLine1",styleDashed|styleNoTitle,maskAll));

SpColor2=ParamColor("SupColor2",ColorRGB(0,200,0));
BrCount=Param("Sup2BarLength",8,1,500,1);
for (i=0;i<BarCount-BrCount;i++) //hide the line except most recent 10 bars
{
	SpColor2[i] = colorBlack;
}


MSPV2 = ValueWhen(Ref(MSP,-1) == 0 AND MSP == 1, SPV1,2);
MSPD2 = ValueWhen(Ref(MSP,-1) == 0 AND MSP == 1, DateNum(),2);
SD2 = IIf(DateNum() < LastValue(MSPD2,lastmode = True ), Null, LastValue(MSPV2,Lastmode = True));
Plot(SD2,"Support2",Spcolor2,ParamStyle("SupportLine2",styleDashed|styleNoTitle,maskAll));

SpColor3=ParamColor("SupColor3",ColorRGB(0,175,0));
BrCount=Param("Sup3BarLength",8,1,500,1);
for (i=0;i<BarCount-BrCount;i++) //hide the line except most recent 10 bars
{
	SpColor3[i] = colorBlack;
}


MSPV3 = ValueWhen(Ref(MSP,-1) == 0 AND MSP == 1, SPV1,3);
MSPD3 = ValueWhen(Ref(MSP,-1) == 0 AND MSP == 1, DateNum(),3);
SD3 = IIf(DateNum() < LastValue(MSPD3,lastmode = True ), Null, LastValue(MSPV3,Lastmode = True));
Plot(SD3,"Support3",SpColor3,ParamStyle("SupportLine3",styleThick|styleDots|styleNoTitle,maskAll));
}
_SECTION_END();


_SECTION_BEGIN("TSKPEBand");
/* Standard Error Bands */
Periods = Param("Standard Error", 20, 3, 200, 1);
Smooth  = Param("Smooth",12,2,100,1);


LRCurve = LinearReg( C, periods );
MALRCurve  = MA(LRCurve, Smooth);
SEValue = StdErr( C, periods );
SErrorAvg =  MA(SEValue, Smooth);

LowerBand = MALRCurve - SErrorAvg ;
UpperBand = MALRCurve + SErrorAvg ;

Plot( MALRCurve , "MidBand", ParamColor("ColorMB",ColorRGB(0,200,0))  , ParamStyle("StyleMB", style=styleDashed, Mask=maskDefault ));
Plot( UpperBand , "UpperBand", ParamColor("ColorUp",colorTeal)  , ParamStyle("StyleUp", style=styleDashed, Mask=maskDefault ));
Plot( LowerBand , "LowerBand", ParamColor("ColorLo",colorTeal), ParamStyle("StyleLo", style=styleDashed, Mask=maskDefault ));
_SECTION_END();

_SECTION_BEGIN("Name");
GfxSetOverlayMode(0);
GfxSelectFont("Tahoma", Status("pxheight")/8 );
GfxSetTextAlign( 6 );
GfxSetTextColor( ColorHSB( 42, 42, 42 ) );
GfxSetBkMode(0);
GfxTextOut( Name(), Status("pxwidth")/2, Status("pxheight")/12 );
GfxSelectFont("Tahoma", Status("pxheight")/18 );
GfxTextOut( IndustryID(1), Status("pxwidth")/2, Status("pxheight")/4 );

GfxSelectFont("Tahoma", Status("pxheight")/18 );
GfxSelectFont("Tahoma", Status("pxheight")/36 );
GfxTextOut( "Chart by Ashraf Samir", Status("pxwidth")/2, Status("pxheight")/3 );
_SECTION_END();

_SECTION_BEGIN("Cloud Setting");
//Cloud
ParmCloud = ParamToggle("Cloud", "No|Yes", 1);

CloudResColor=ParamColor("CloudResColor",ColorRGB(15,15,15));
CR=Upperband;
CS=Lowerband;

if(parmCloud == 1)
{
	PlotOHLC( CS, CS, CR,CR, "Band", CloudResColor, styleCloud | styleNoLabel|styleNoTitle);
}

_SECTION_END();

GfxSetBkColor(colorBlack);
GfxSetTextColor( colorGold );
GfxSelectFont("Edwardian Script ITC", 40, 500, True );
GfxTextOut("Ashraf Samir  ", 760 , 0 );
7 comments
Leave Comment
Please login here to leave a comment.
This is in fact “pathfinder.afl”. It was NOT developed by soutjbreeze but by signrc.
Would folks STOP plagerising BUT rather give vredit where, when and to who it is due.
when to buy and when to sell following this indicator? Please could anybody explain me.
This is really Pathfinder.afl (see my comments under Pathfinder). Am I wrong???
This is Pathfinder trimmed of some weight. Smooth indicator.
SOME PROBLEM AND SHOWING AS SYNTEX ERROR.COULD YOU PLEASE RECTIFY OR KINDLY INSTRUCT.WILL BE VERY GREATFULL
is it realtime signal giving? probably not.
It seems to be nice afl. I have started using it.
Just one question:
> Is there a way to change the pivot shape to circle. That would really be great.
Thanks.