Stock Portfolio Organizer
The ultimate porfolio management solution.
Shares, Margin, CFD's, Futures and Forex
EOD and Realtime
Dividends and Trust Distributions
And Much More ....
WiseTrader Toolbox
#1 Selling Amibroker Plugin featuring:
Advanced Adaptive Indicators
Advanced Pattern Exploration
Neural Networks
And Much More ....
MAMA Positional System v1.0 for Amibroker (AFL)
Rating:
5 / 5 (Votes 6)
Tags:
trading system, amibroker
This is the MAMA positional system developed by Karthimarar.
Screenshots
Similar Indicators / Formulas
EMA crossover
Submitted
by Ketan-0 over 15 years ago
Kase Peak Osc. V2 batu
Submitted
by batu1453 almost 12 years ago
Kase CD V2batu
Submitted
by batu1453 almost 12 years ago
Ichimoku
Submitted
by prashantrdx almost 12 years ago
Adaptive Price Zone (APZ)
Submitted
by AndrewThomas over 15 years ago
LANDIS Modified
Submitted
by isfandi over 15 years ago
Indicator / Formula
Copy & Paste Friendly
_SECTION_BEGIN("MAMA");
SetBarsRequired( 10000, 10000 );
SetChartOptions(0,chartShowArrows|chartShowDates);
prc = ( High + Low ) / 2;
fastlimit = 0.5;
slowlimit = 0.05;
pi=4*atan(1);
RTD=180/pi;
DTR=pi/180;
Cyclepart=Param("Alpha",0.5,0.1,1,0.1);
Smooth[0] = Period = Detrender[0] = I1[0] = Q1[0] = 0;
phase[0]=deltaphase[0]=MAMA[0]=FAMA[0]=0;
for ( i = 6; i < BarCount; i++ )
{
Smooth[i] = ( 4 * prc[i] + 3 * prc[i-1] + 2 * prc[i-2] + prc[i-3] ) / 10;
AmpCorr[i] = 0.075 * Period[i-1] + 0.54;
Detrender[i] = ( 0.0962 * Smooth[i] + 0.5769 * Smooth[i-2] - 0.5769 * Smooth[i-4] - 0.0962 * Smooth[i-6] ) * AmpCorr[i];
Q1[i] = ( 0.0962 * Detrender[i] + 0.5769 * Detrender[i-2] - 0.5769 * Detrender[i-4] - 0.0962 * Detrender[i-6] ) * AmpCorr[i];
I1[i] = Detrender[i-3];
if (I1[i] != 0) phase[i] = DTR*360/atan(q1[i]/I1[i]);
deltaphase[i]=phase[i-1]-phase[i];
if (deltaphase[i] <1) deltaphase[i]=1;
alpha[i]=fastlimit[i]/deltaphase[i];
if (alpha[i] < slowlimit[i]) alpha[i]=slowlimit[i];
MAMA[i]=alpha[i] * prc [i] +(1-alpha[i])*MAMA[i-1];
FAMA[i]=Cyclepart*alpha[i] * prc [i] +(1-Cyclepart*alpha[i])*FAMA[i-1];
}
Plot( MAMA, "MAMA", colorTurquoise, styleLine|styleThick );
Plot( FAMA, "FAMA", colorYellow, styleLine|styleThick );
PlotOHLC(O,H,L,C,"MAMA",IIf(MAma>fama,colorLime,colorRed),styleBar|styleThick);
_SECTION_END();
_SECTION_BEGIN("SYSTEM");
BuySetupValue=ValueWhen(Cross(MAMA,FAMA),H,1);
SellsetupValue=ValueWhen(Cross(FAMA,MAMA),L,1);
Buysetup =Cross(MAMA,FAMA) ;
Sellsetup = Cross(FAMA,MAMA);
Longa = Flip(Buysetup,Sellsetup);
shrta = Flip(Sellsetup,Buysetup);
Buy=Longa AND Cross(C,BuySetupValue);
Sell=shrta AND Cross(SellsetupValue,C);
Buy = ExRem(Buy,Sell);
Sell = ExRem(Sell,Buy);
t1= Flip(Buy,Sell);
t2= Flip(Sell,Buy);
BPrice=ValueWhen(t1 AND Ref(t1,-1)==0,C,1);
SPrice=ValueWhen(t2 AND Ref(t2,-1)==0,C,1);
GraphXSpace = 5;
dist = 1.5*ATR(20);
for( i = 0; i < BarCount; i++ )
{
if( Buy[i] ) PlotText( "" + C[ i ], i, L[ i ]-dist[i], colorLime );
if( Sell[i] ) PlotText( "" + C[ i ], i, H[ i ]+dist[i], colorYellow );
}
_SECTION_END();
//=================TITLE================================================================================================
_SECTION_BEGIN("Title");
if( Status("action") == actionIndicator )
(
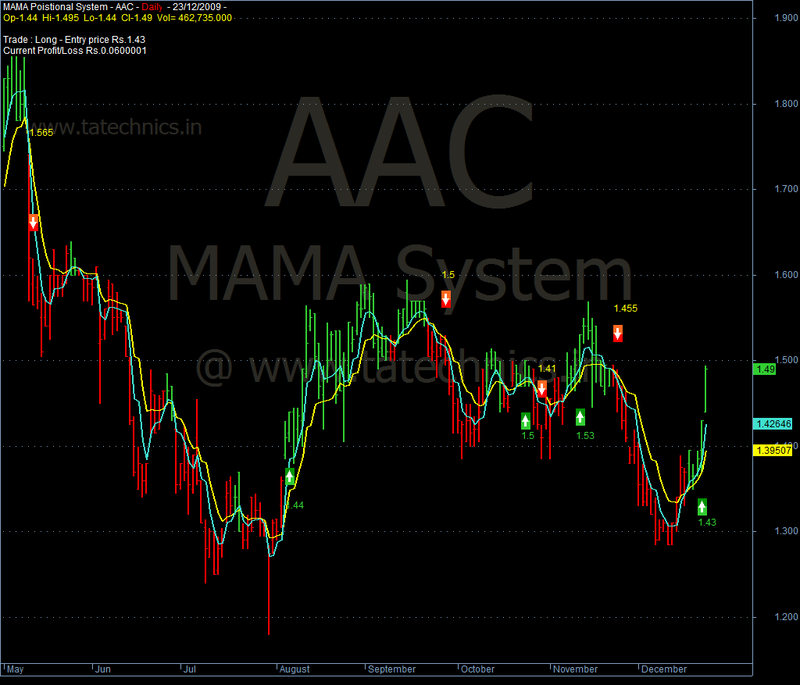
Title = EncodeColor(colorWhite)+ "MAMA Poistional System" + " - " + Name() + " - " + EncodeColor(colorRed)+ Interval(2) + EncodeColor(colorWhite) +
" - " + Date() +" - "+"\n" +EncodeColor(colorYellow) +"Op-"+O+" "+"Hi-"+H+" "+"Lo-"+L+" "+
"Cl-"+C+" "+ "Vol= "+ WriteVal(V)+"\n"+
EncodeColor(colorLime)+
WriteIf (Buy , " GO LONG / Reverse Signal at "+C+" ","")+
WriteIf (Sell , " EXIT LONG / Reverse Signal at "+C+" ","")+"\n"+EncodeColor(colorWhite)+
WriteIf(Sell , "Total Profit/Loss for the Last Trade Rs."+(C-BPrice)+"","")+
WriteIf(Buy , "Total Profit/Loss for the Last trade Rs."+(SPrice-C)+"","")+
WriteIf(Longa AND NOT Buy, "Trade : Long - Entry price Rs."+(BPrice),"")+
WriteIf(shrta AND NOT Sell, "Trade : Short - Entry price Rs."+(SPrice),"")+"\n"+
WriteIf(Longa AND NOT Buy, "Current Profit/Loss Rs."+(C-BPrice)+"","")+
WriteIf(shrta AND NOT Sell, "Current Profit/Loss Rs."+(SPrice-C)+"",""));
PlotShapes(IIf(Buy, shapeSquare, shapeNone),colorGreen, 0, L, Offset=-40);
PlotShapes(IIf(Buy, shapeSquare, shapeNone),colorLime, 0,L, Offset=-50);
PlotShapes(IIf(Buy, shapeUpArrow, shapeNone),colorWhite, 0,L, Offset=-45);
PlotShapes(IIf(Sell, shapeSquare, shapeNone),colorRed, 0, H, Offset=40);
PlotShapes(IIf(Sell, shapeSquare, shapeNone),colorOrange, 0,H, Offset=50);
PlotShapes(IIf(Sell, shapeDownArrow, shapeNone),colorWhite, 0,H, Offset=-45);
_SECTION_END();
WriteVal(BuyPrice);
WriteVal(Longa);
WriteVal(t1);
WriteVal(SellPrice);
WriteVal(shrta);
_SECTION_END();
//=========================== Back ground Text ===================
_SECTION_BEGIN("Background text");
GfxSetOverlayMode(1);
GfxSelectFont("Tahoma", Status("pxheight")/6 );
GfxSetTextAlign( 6 );// center alignment
//GfxSetTextColor( ColorRGB( 60, 45, 80 ) );
GfxSetTextColor( ColorHSB( 42, 42, 42 ) );
//GfxSetTextColor( ColorHSB( 5, 5,242) );
GfxSetBkMode(0); // transparent
GfxTextOut( Name(), Status("pxwidth")/2, Status("pxheight")/12 );
GfxSelectFont("Tahoma", Status("pxheight")/12 );
GfxTextOut( "MAMA System", Status("pxwidth")/2, Status("pxheight")/3 );
GfxSelectFont("Tahoma", Status("pxheight")/20 );
GfxTextOut( "@ www.tatechnics.in", Status("pxwidth")/2, Status("pxheight")/2 );
GfxSelectFont("Tahoma", Status("pxheight")/40);
GfxTextOut( "www.tatechnics.in", Status("pxwidth")/7, Status("pxheight")/6);
_SECTION_END();8 comments
Leave Comment
Please login here to leave a comment.
Back
MAMA-FAMA is one of the best indicators ever, the mother of Moving Averages.
Thanks a lot.
for the fans of this system…here is a theory on MAMA/FAMA http://www.forexfactory.com/attachment.php?attachmentid=39171&d=1184696239
SOME KIND OF A SYNTAX ERROR LINE 14
DOES ANY ONE KNOW HOW TO FIX ERRORS I AM USING AB 5.50.04
Formula is good till 5.20 to 5.40 ( tested ) not sure abt 5.50 though. no errors.
Can anyone show how to create formula function for MAMA to be able to use for creating own system adding other indicators. I want to backtest this in amibrok5.4 . Also want to use MAMA as an indicator for other combinations. Thanks .Regards, God Bless All
There is something wrong with the translation of the code from the book Rocket Science for Traders by John Ehlers. Code in the book is for tradestation, and in tradestation easylanguage the function ArcTangent() gives result in degrees while the equivalent function atan() in Amibroker AFL gives result in radians.
Line 22 of the code by Karthimarar should read:
if (I1[i] != 0) phase[i] = RTD*atan(q1[i]/I1[i]); //wrong = DTR*360/atan(q1[i]/I1[i])
In the book in Tradestation easylanguage the code of this line is:
If I1 <>0 then Phase = (ArcTangent(Q1/I1)
So, if ArcTangent(Q1/I1) gives the result in degrees and in AFL atan() gives the result in radians you must convert the radians to degrees by multiplying the result by 180/pi or by RTD (Radians to Degrees) in the code.
FOR INTRADAY WHAT IS TIME FRAME FOR
1)CRUDEOIL
2)BANKNIFTY
3)NSE STOCKS