MultiCycle 1.0 for Amibroker (AFL)
mamunbaf9117 over 15 years ago Amibroker (AFL)
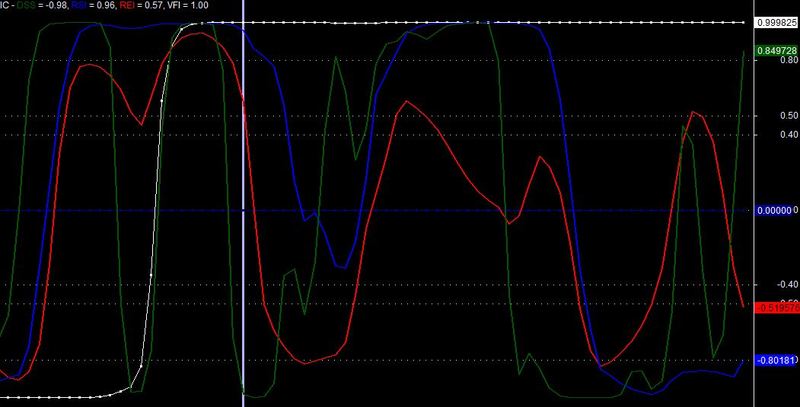
MultiCycle 1.0 created by Brian Richard in the year 2004.
This looks at four different cyclic indicators together at one time. When
three oscillators synchronize, this signals a strong buy or sell.
The white dotted line is the Volume Flow Indicator, or VFI. If the VFI is
above the zero line, look for synchronized oscillators rising out of an
oversold condition — this is a good buy signal. If VFI is below zero, look
for overbought conditions and short, instead.
The REI is Tom DeMark’s Range Expansion Index. This is the most leading
indicator included here. The DSS is a double-smoothed stochastic, good for
timing and exact buy or sell point. And the IFT is the Inverse Fisher
Transform function.
This indicator works well for any time frame. All it takes is a little
getting used to before you become intuitive with it.
Screenshots
Indicator / Formula
_SECTION_BEGIN("MultiCycle 1.0");
//------------------------------------------------------------------------------
//
//  This looks at four different cyclic indicators together at one time. When
//  three oscillators synchronize, this signals a strong buy or sell.
//
//  The white dotted line is the Volume Flow Indicator, or VFI. If the VFI is
//  above the zero line, look for synchronized oscillators rising out of an
//  oversold condition -- this is a good buy signal. If VFI is below zero, look
//  for overbought conditions and short, instead.
//
//  The REI is Tom DeMark's Range Expansion Index. This is the most leading
//  indicator included here. The DSS is a double-smoothed stochastic, good for
//  timing and exact buy or sell point. And the IFT is the Inverse Fisher
//  Transform function.
//
//  This indicator works well for any time frame. All it takes is a little
//  getting used to before you become intuitive with it.
//
//  I named it the MultiCycle for lack of a better name.
//
//------------------------------------------------------------------------------

/*
MULTICYCLE 1.0
By Brian Richard
*/

/* Volume Flow Indicator */
Period = Param("VFI Period",26,26,1300,1);
Coef=0.2;
VCoef=Param("Max. vol. cutoff",2.5,2.5,50,1);
inter = log(Avg)-log(Ref(Avg,-1));
Vinter = StDev(inter,30);
Cutoff=Coef*Vinter*Close;
Vave=Ref(MA(V,Period),-1);
Vmax=Vave*Vcoef;
Vc=Min(V,VMax);
MF=Avg-Ref(Avg,-1);
VCP=IIf(MF>Cutoff,VC,IIf(MF<-Cutoff,-VC,0));
VFI1=Sum(VCP,Period)/Vave;
VFI=EMA(VFI1,3);

/* Double Smoothed Stochastic - DSS */
Slw = 4;  Pds = 4;
A = EMA((Close-LLV(Low,Pds))/(HHV(H,pds)-LLV(L,Pds)),Slw)*100;
DSS = EMA((A-LLV(A,pds))/(HHV(A,Pds)-LLV(A,Pds)),Slw)*100;

/* Tom DeMark's Range Expansion Index  */
HighMom = H - Ref( H, -2 );
LowMom = L - Ref( L, -2 );
Cond1 = ( H >= Ref( L,-5) OR H >= Ref( L, -6 ) );
Cond2 = ( Ref( H, -2 ) >= Ref( C, -7 ) OR Ref( H, -2 ) >= Ref( C, -8 ) );
Cond3 = ( L <= Ref( H, -5 ) OR L <= Ref( H, -6) );
Cond4 = ( Ref( L, -2 ) <= Ref( C, -7 ) OR Ref( L, -2 ) <= Ref( C, -8 ) );
Cond = ( Cond1 OR Cond2 ) AND ( Cond3 OR Cond4 );
Num = IIf( Cond, HighMom + LowMom, 0 );
Den = abs(  HighMom ) + abs( LowMom );
TDREI = 100 * Sum( Num, 5 )/Sum( Den, 5 ) ;

// General - purpose Inverse Fisher Transform function
function InvFisherTfm1( array1 )
{
  e2y1 = exp( 2 * array1 );
  return ( e2y1 - 1 )/( e2y1 + 1 );
}
function InvFisherTfm2( array2 )
{
  e2y2 = exp( 2 * array2 );
  return ( e2y2 - 1 )/( e2y2 + 1 );
}
function InvFisherTfm3( array3 )
{
  e2y3 = exp( 2 * array3 );
  return ( e2y3 - 1 )/( e2y3 + 1 );
}

function InvFisherTfm4( array4 )
{
  e2y4 = exp( 2 * array4 );
  return ( e2y4 - 1 )/( e2y4 + 1 );
}

Value1 = 0.1 * (DSS-55);
Value2 = WMA( Value1, 5 );

Value3 = 0.1 * ( RSI( 5 ) - 50 );
Value4 = WMA( Value3, 10 );

Value5 = 0.03 * (TDREI);
Value6 = WMA( Value5, 10 );

Value10 = VFI;
Value11 = EMA(VFI,10);

Plot( InvFisherTfm1( Value2 ), "DSS", colorDarkGreen, styleThick );
Plot( InvFisherTfm2( Value4 ), "RSI", colorBlue, styleThick );
Plot( InvFisherTfm3( Value6 ), "REI", colorRed, styleThick );
Plot( InvFisherTfm4( Value11 ), "VFI", colorWhite, styleDots );

Plot(0,"",colorDarkBlue,styleDots);
PlotGrid( 0.5 );
PlotGrid(-0.5 );
_SECTION_END();
3 comments
Leave Comment
Please login here to leave a comment.
Excellent thanks
Hi, it is good. Have coded buy sell signals for this system ?
Hi this is good indicator, thanks for share