Boll Fibo Ashi Band for Amibroker (AFL)
Rushabh over 15 years ago Amibroker (AFL)
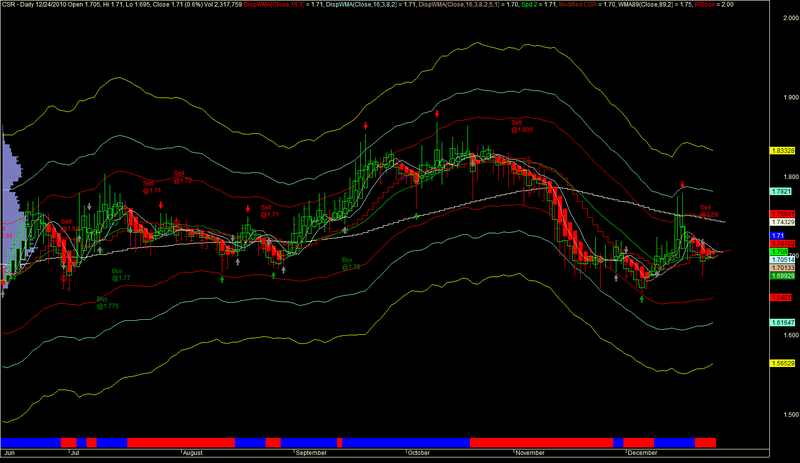
This formula is mixture of Bollinger Band Fibonacci Ratio and Heikin Ashi. Just Follow the Signal.
Recently I found “WISESTOCKTRADER” , this is very useful site and this is my 1st attempt posting Formula.
Thanks.
Screenshots
Indicator / Formula
Copy & Paste Friendly
_SECTION_BEGIN("DispWMA");
P = ParamField("Field");
Type = ParamList("Type", "Weighted,Simple,Exponential,Double Exponential,Tripple Exponential,Wilders");

Periods16 = Param("Periods16", 16, 2, 300 );
Displacement3 = Param("Displacement3", 3, -50, 50 );
Plot( WMA( P, Periods16 ), _DEFAULT_NAME(), colorRed, styleStaircase, 0, 0, Displacement3  );
m = 0;

Periods8 = Param("Periods8", 8, 2, 300 );
Displacement2 = Param("Displacement2", 2, -50, 50 );
Plot( WMA( P, Periods8 ), _DEFAULT_NAME(), colorSkyblue,styleLine, 0, 0, Displacement2  );
m =0;

Periods5 = Param("Periods5", 5, 2, 300 );
Displacement1 = Param("Displacement1", 1, -50, 50 );
Plot( WMA( P, Periods5 ), _DEFAULT_NAME(), colorTan,styleLine, 0, 0, Displacement1  );
m = 0;

_SECTION_END();

_SECTION_BEGIN("Speed Lines");
P2 = 2;
Plot( EMA( C, P2 ), "Spd 2" , colorBrightGreen,styleStaircase | styleThick );

_SECTION_END();

_SECTION_BEGIN("trend candle");
////////////////////////////////////
// Heikin_Ashi For Amibroker
////////////////////////////////////

HaClose =EMA((O+H+L+C)/4,3);
HaOpen = AMA( Ref( HaClose, -1 ), 0.5 );
HaHigh = Max( H, Max( HaClose, HaOpen ) );
HaLow = Min( L, Min( HaClose, HaOpen ) );
PlotOHLC( HaOpen, HaHigh, HaLow, HaClose, "Modified " + Name(), colorBrown, styleCandle | styleNoLabel );
//SetChartBkGradientFill( ParamColor("BgTop", colorBrightGreen),ParamColor("BgBottom", colorSeaGreen));
Title="";
_SECTION_END();

_SECTION_BEGIN("MABIUTS");
SetChartOptions(0,chartShowArrows|chartShowDates);
_N(Title = StrFormat("{{NAME}} - {{INTERVAL}} {{DATE}} Open %g, Hi %g, Lo %g, Close %g (%.1f%%) Vol " +WriteVal( V, 1.0 ) +" {{VALUES}}", O, H, L, C, SelectedValue( ROC( C, 1 )) ));

Buy=EMA(C,13)>EMA(EMA(C,13),9) AND Cross (C,Peak(C,5,1));
Sell=Cross (EMA(EMA(C,13),9),EMA(C,13));
MYcolor = IIf( EMA(C,13)>EMA(EMA(C,13),9) AND C>Peak(C,2,1), colorGreen, IIf(EMA(C,13)>EMA(EMA(C,13),9) AND C<Peak(C,2,1),colorBlue, colorBrown ));

PlotOHLC( Open, High, Low, Close, "", Mycolor, styleBar );

shape = Buy * shapeHollowStar + Sell * shapeHollowStar;
PlotShapes( shape, IIf( Buy, colorGreen, colorRed ),0, IIf( Buy, Low, High ) );

GraphXSpace = 5;
dist = 1.5*ATR(10);

for( i = 0; i < BarCount; i++ )
{
if( Buy[i] ) PlotText( "Buy\n@" + C[ i ], i, L[ i ]-dist[i], colorGreen );
if( Sell[i] ) PlotText( "Sell\n@" + C[ i ], i, H[ i ]+dist[i], colorRed);
}


_SECTION_END();

_SECTION_BEGIN("WMA89");
P = ParamField("Field");
Type = ParamList("Type", "Weighted,Simple,Exponential,Double Exponential,Tripple Exponential,Wilders");

Periods89 = Param("Periods89", 89, 2, 300 );
Displacement2 = Param("Displacement2", 2, -50, 50 );
Plot( WMA( P, Periods89 ), _DEFAULT_NAME(), colorLightYellow, styleStaircase, 0, 0, Displacement2  );

_SECTION_END();

_SECTION_BEGIN("7_Volume At Price");
PlotVAPOverlay( Param("Lines", 300, 100, 1000, 1 ), Param("Width", 5, 1, 100, 1 ), ParamColor("Color", colorBlueGrey ), ParamToggle("Side", "Right" ) | 4*ParamToggle("Z-order", "On top|Behind", 1 ) );

_SECTION_END();

_SECTION_BEGIN("swing");

SetChartOptions(0,chartShowArrows|chartShowDates);
//_N(Title = StrFormat("{{NAME}} - {{INTERVAL}} {{DATE}} Open %g, Hi %g, Lo %g, Close %g (%.1f%%) {{VALUES}}", O, H, L, C, SelectedValue( ROC( C, 1 ) ) ));
//Plot( C, "Close", ParamColor("Color", colorGrey50 ), styleNoTitle | ParamStyle("Style") | GetPriceStyle() );
no=Param( "Swing", 2, 0, 55 );
tsl_col=ParamColor( "Color", colorGrey50 );

res=HHV(H,no);
sup=LLV(L,no);
avd=IIf(C>Ref(res,-1),1,IIf(C<Ref(sup,-1),-1,0));
avn=ValueWhen(avd!=0,avd,1);
tsl=IIf(avn==1,sup,res);

//Plot(tsl, _DEFAULT_NAME(), tsl_col, styleStaircase);

Buy=Cross(C,tsl);
Sell=Cross(tsl,C);
shape=Buy*shapeUpArrow + Sell*shapeDownArrow;
PlotShapes(shape,IIf(Buy,tsl_col,tsl_col),0,IIf(Buy,Low,High));
_SECTION_END();
_SECTION_BEGIN("Bollinger Fibonacci Bands");
// Bollinger Fibonacci Bands - Beachie41 26/11/04 //
/* as used in the VT trading platform -
 see outline of FX trading system by mezarashii on
Moneytec http://www.moneytec.com/forums/_showthread/_threadid-11630/_s-
 */
GraphXSpace = 3;
per = Param("Period",21,8,55,1);
TH =IIf(Ref(C,-1) > H,Ref(C,-1),H);

TL=IIf(Ref(C,-1) < L,Ref(C,-1),L);
TR = TH-TL;
TRa= Wilders(TR,per);
UpperBand3 =MA( C, per) + ( 4.2360 * TRa);
UpperBand2=MA( C, per) + ( 2.6180 * TRa);
UpperBand1=MA( C, per) + ( 1.6180 * TRa);

MidPoint=MA(C, per);

LowerBand1=MA( C, per) - ( 1.6180 * TRa);
LowerBand2=MA( C, per) - ( 2.6180 * TRa);
LowerBand3=MA( C, per) - ( 4.2360 * TRa);


Plot(MidPoint,"",colorGreen,4);
Plot(UpperBand1,"",colorRed,1);
Plot(LowerBand1,"",colorRed,1);
Plot(UpperBand2,"",colorAqua,1);
Plot(LowerBand2,"",colorAqua,1);
Plot(UpperBand3,"",colorYellow,1);
Plot(LowerBand3,"",colorYellow,1);


//PlotOHLC(O,H,L,C,"",colorWhite,64);
_SECTION_END();

_SECTION_BEGIN("Ribbon");
// ribbon code
Plot( 2, "Ribbon",IIf(C>tsl,colorBlue,colorRed),styleOwnScale|styleArea|styleNoLabel, -0.5, 100 );
_SECTION_END();

/* **********************************

Code to automatically identify pivots

********************************** */

// -- what will be our lookback range for the hh and ll?
farback=Param("How Far back to go",100,50,5000,10);
nBars = Param("Number of bars", 12, 5, 40);

// -- Title.

//Title = Name() + " (" + StrLeft(FullName(), 15) + ") O: " + Open + ",

//H: " + High + ", L: " + Low + ", C: " + Close;

// -- Plot basic candle chart

//PlotOHLC(Open, High, Low, Close,

//"BIdx = " + BarIndex() +

//"\n" + "O = " + O + "\n"+"H = "+ H + "\n"+"L = " + L

//+ "\n"+"C ",

//colorBlack, styleCandle);

GraphXSpace=7;

// -- Create 0-initialized arrays the size of barcount

aHPivs = H - H;

aLPivs = L - L;

// -- More for future use, not necessary for basic plotting

aHPivHighs = H - H;

aLPivLows = L - L;

aHPivIdxs = H - H;

aLPivIdxs = L - L;

nHPivs = 0;

nLPivs = 0;

lastHPIdx = 0;

lastLPIdx = 0;

lastHPH = 0;

lastLPL = 0;

curPivBarIdx = 0;

// -- looking back from the current bar, how many bars

// back were the hhv and llv values of the previous

// n bars, etc.?

aHHVBars = HHVBars(H, nBars);

aLLVBars = LLVBars(L, nBars);

aHHV = HHV(H, nBars);

aLLV = LLV(L, nBars);

// -- Would like to set this up so pivots are calculated back from

// last visible bar to make it easy to "go back" and see the pivots

// this code would find. However, the first instance of

// _Trace output will show a value of 0

aVisBars = Status("barvisible");

nLastVisBar = LastValue(Highest(IIf(aVisBars, BarIndex(), 0)));

_TRACE("Last visible bar: " + nLastVisBar);

// -- Initialize value of curTrend

curBar = (BarCount-1);

curTrend = "";

if (aLLVBars[curBar] <

aHHVBars[curBar]) {

curTrend = "D";

}

else {

curTrend = "U";

}

// -- Loop through bars. Search for

// entirely array-based approach

// in future version

for (i=0; i<farback; i++) {

curBar = (BarCount - 1) - i;

// -- Have we identified a pivot? If trend is down...

if (aLLVBars[curBar] < aHHVBars[curBar]) {

// ... and had been up, this is a trend change

if (curTrend == "U") {

curTrend = "D";

// -- Capture pivot information

curPivBarIdx = curBar - aLLVBars[curBar];

aLPivs[curPivBarIdx] = 1;

aLPivLows[nLPivs] = L[curPivBarIdx];

aLPivIdxs[nLPivs] = curPivBarIdx;

nLPivs++;

}

// -- or current trend is up

} else {

if (curTrend == "D") {

curTrend = "U";

curPivBarIdx = curBar - aHHVBars[curBar];

aHPivs[curPivBarIdx] = 1;

aHPivHighs[nHPivs] = H[curPivBarIdx];

aHPivIdxs[nHPivs] = curPivBarIdx;

nHPivs++;

}

// -- If curTrend is up...else...

}

// -- loop through bars

}

// -- Basic attempt to add a pivot this logic may have missed

// -- OK, now I want to look at last two pivots. If the most

// recent low pivot is after the last high, I could

// still have a high pivot that I didn't catch

// -- Start at last bar

curBar = (BarCount-1);

candIdx = 0;

candPrc = 0;

lastLPIdx = aLPivIdxs[0];

lastLPL = aLPivLows[0];

lastHPIdx = aHPivIdxs[0];

lastHPH = aHPivHighs[0];

if (lastLPIdx > lastHPIdx) {

// -- Bar and price info for candidate pivot

candIdx = curBar - aHHVBars[curBar];

candPrc = aHHV[curBar];

if (

lastHPH < candPrc AND

candIdx > lastLPIdx AND

candIdx < curBar) {


// -- OK, we'll add this as a pivot...

aHPivs[candIdx] = 1;

// ...and then rearrange elements in the

// pivot information arrays

for (j=0; j<nHPivs; j++) {

aHPivHighs[nHPivs-j] = aHPivHighs[nHPivs-

(j+1)];

aHPivIdxs[nHPivs-j] = aHPivIdxs[nHPivs-(j+1)];

}

aHPivHighs[0] = candPrc ;

aHPivIdxs[0] = candIdx;

nHPivs++;

}

} else {


// -- Bar and price info for candidate pivot

candIdx = curBar - aLLVBars[curBar];

candPrc = aLLV[curBar];

if (

lastLPL > candPrc AND

candIdx > lastHPIdx AND

candIdx < curBar) {


// -- OK, we'll add this as a pivot...

aLPivs[candIdx] = 1;

// ...and then rearrange elements in the

// pivot information arrays

for (j=0; j<nLPivs; j++) {

aLPivLows[nLPivs-j] = aLPivLows[nLPivs-(j+1)];

aLPivIdxs[nLPivs-j] = aLPivIdxs[nLPivs-(j+1)];

}

aLPivLows[0] = candPrc;

aLPivIdxs[0] = candIdx;

nLPivs++;

}

}

// -- Dump inventory of high pivots for debugging

/*

for (k=0; k<nHPivs; k++) {

_TRACE("High pivot no. " + k

+ " at barindex: " + aHPivIdxs[k] + ", "

+ WriteVal(ValueWhen(BarIndex()==aHPivIdxs[k],

DateTime(), 1), formatDateTime)

+ ", " + aHPivHighs[k]);

}

*/

// -- OK, let's plot the pivots using arrows

PlotShapes(

IIf(aHPivs==1, shapeDownArrow, shapeNone), colorRed, 0,

High, Offset=-15);

PlotShapes(

IIf(aLPivs==1, shapeUpArrow , shapeNone), colorGreen, 0,

Low, Offset=-15);
1 comments
Leave Comment
Please login here to leave a comment.
Hi !!
Thanks for posting an exciting formulation. I will try it on trading analysis.
Atul