Stock Portfolio Organizer

The ultimate porfolio management solution.

Shares, Margin, CFD's, Futures and Forex
EOD and Realtime
Dividends and Trust Distributions
And Much More ....
For Portfolio Manager Click Here

WiseTrader Toolbox

#1 Selling Amibroker Plugin featuring:

Advanced Adaptive Indicators
Advanced Pattern Exploration
Neural Networks
And Much More ....
Find Out More Here

Auto Support-Pivot-Resis levels with Swing Edited for Amibroker (AFL)

Rating:
3 / 5 (Votes 5)
Tags:
amibroker, pivots

Hi,

here i am posting my Swing with Pivots levels, which is working very good in MCX.
if there is any doubt any problem feel free to call me 8 8 7 0 5 3 4 3 9 1. mail me niftyhitech@yahoo.com
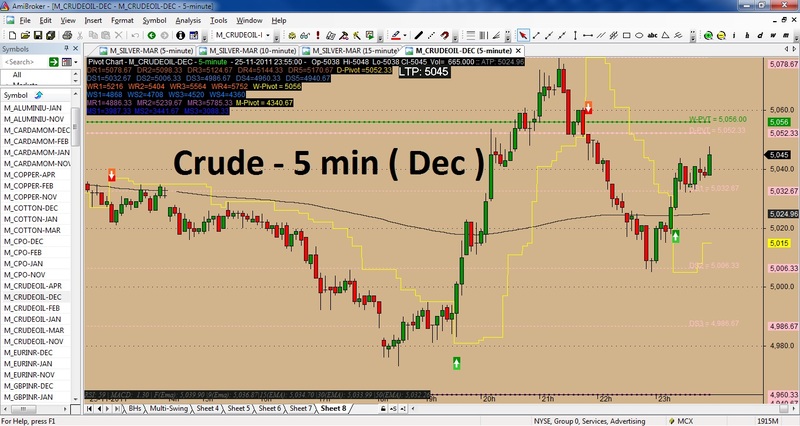
Screenshots

Similar Indicators / Formulas

Pivots and prices
Submitted by kaiji over 14 years ago
Pivots
Submitted by kkumar almost 12 years ago
Pivots And Prices And Swing Volume
Submitted by esnataraj almost 14 years ago
Camarilla Pivots
Submitted by novicetraders almost 14 years ago
Pivot Trading All-In-One
Submitted by kirthi1987 about 14 years ago
Daily, Weekly and Monthly Pivots
Submitted by sam_u6 about 14 years ago

Indicator / Formula

Copy & Paste Friendly
_SECTION_BEGIN("Price");
SetChartOptions(0,chartShowArrows|chartShowDates);
_N(Title = StrFormat("{{NAME}} - {{INTERVAL}} {{DATE}} Open %g, Hi %g, Lo %g, Close %g (%.1f%%) {{VALUES}}", O, H, L, C, SelectedValue( ROC( C, 1 ) ) ));
Plot( C, "Close", ParamColor("Color", colorBlack ), styleNoTitle | ParamStyle("Style") | GetPriceStyle() ); 
_SECTION_END();


_SECTION_BEGIN("Ramesh.S.R Pivot Chart");
_SECTION_BEGIN("xtl");

SetChartBkColor(ParamColor("Outer panel color ",colorLightGrey));
tgt = 37;
a = CCI(20) < -tgt;
b = CCI(20) > tgt;
state = IIf(a>b,-1,IIf(a==b,0,1));
Color = IIf(state == 0, colorBlue, IIf(state == 1, colorGreen, IIf(state == -1, colorRed, 0)));

//Plot(state, "", color, styleHistogram);

//SetChartOptions( 0, chartShowDates | chartShowArrows | chartLogarithmic | chartWrapTitle );
//_N(Title = StrFormat("{{NAME}} - {{INTERVAL}} {{DATE}} Open %g, Hi %g, Lo %g, Close %g (%.1f%%) {{VALUES}}", O, H, L, C, SelectedValue( ROC( C, 1 ) ) ));
//Plot( C, "Close", color, styleNoTitle |styleBar|styleThick);
 

  _SECTION_BEGIN("Ramesh Swing");
//Copyright Kamalesh Langote. Email:rameshram_isp@yahoo.co.in. More details at http://niftyhitech.blogspot.com/
//Save indicator as "ramesh.afl" in C: program files > Amibroker > Formulas > Custom folder and then drap and drop on price chart
no=Param( "Swing", 20, 1, 55 );
tsl_col=ParamColor( "Color", colorCycle );

res=HHV(H,no);
sup=LLV(L,no);
avd=IIf(C>Ref(res,-1),1,IIf(C<Ref(sup,-1),-1,0));
avn=ValueWhen(avd!=0,avd,1);
tsl=IIf(avn==1,sup,res);

// Plot(tsl, _DEFAULT_NAME(), tsl_col, styleThick |styleThick); // or styleaArea

Plot(tsl, _DEFAULT_NAME(), tsl_col, styleThick |styleStaircase); // or styleaArea


Buy=Cross(C,tsl);
Sell=Cross(tsl,C);
PlotShapes(IIf(Buy, shapeSquare, shapeNone),colorGreen, 0, L, Offset=-40);
PlotShapes(IIf(Buy, shapeSquare, shapeNone),colorLime, 0,L, Offset=-50);                      
PlotShapes(IIf(Buy, shapeUpArrow, shapeNone),colorWhite, 0,L, Offset=-45);
PlotShapes(IIf(Sell, shapeSquare, shapeNone),colorRed, 0, H, Offset=40);
PlotShapes(IIf(Sell, shapeSquare, shapeNone),colorOrange, 0,H, Offset=50);                      
PlotShapes(IIf(Sell, shapeDownArrow, shapeNone),colorWhite, 0,H, Offset=-45);

_SECTION_END();

_SECTION_BEGIN("pivots mw");
SetChartBkColor(2) ;
k=IIf(ParamList("select type","daily|next day")=="daily",-1,0);
k1=-1;
TimeFrameSet(inDaily);
day_h= LastValue(Ref(H,K));
day_l= LastValue(Ref(L,K));
day_c= LastValue(Ref(C,K));
TimeFrameRestore();
 
TimeFrameSet(inWeekly);
Week_h= LastValue(Ref(H,K1));
Week_l= LastValue(Ref(L,K1));;
Week_c= LastValue(Ref(C,K1));;
TimeFrameRestore();
 
TimeFrameSet(inMonthly);
month_h= LastValue(Ref(H,K1));
month_l= LastValue(Ref(L,K1));
month_c= LastValue(Ref(C,K1));
TimeFrameRestore();
 
/*--------------------------------------*/
// day
DH=Day_h;
DL=Day_L;
DC=Day_C;
 
// DAY PIVOT Calculation
pd = ( DH+ DL + DC )/3;
sd1 = (2*pd)-DH;
sd2 = pd -(DH - DL);
sd3 = Sd1 - (DH-DL);
sd4 = Sd2 - (DH-DL);
sd5 = Sd3 - (DH-DL);
rd1 = (2*pd)-DL;
rd2 = pd +(DH -DL);
rd3 = rd1 +(DH-DL);
rd4 = rd2 +(DH-DL);
rd5 = rd3 +(DH-DL);
dp=pd;
// week
WH=Week_h;
WL=Week_l;
WC=Week_c;
 
// WEEK PIVOT Calculation
pw = ( WH+ WL + WC )/3;
sw1 = (2*pw)-WH;
sw2 = pw -(WH - WL);
sw3 = Sw1 - (WH-WL);
sw4 = Sw2 - (WH-WL);
rw1 = (2*pw)-WL;
rw2 = pw +(WH -WL);
rw3 = rw1 +(WH-WL);
rw4 = rw2 +(WH-WL);
 
 
// month
MH=month_h;
ML=month_l;
MC=month_c;
 
// MONTH PIVOT Calculation
pm = ( MH+ ML + MC )/3;
sm1 = (2*pm)-MH;
sm2 = pm -(MH - ML);
sm3 = Sm1 - (MH-ML);
rm1 = (2*pm)-ML;
rm2 = pm +(MH -ML);
rm3 = rm1 +(MH-ML);
 
ppl = ParamToggle("Plot Pivot Levels","Off|On",1);
numbars = LastValue(Cum(Status("barvisible")));
fraction= IIf(StrRight(Name(),3) == "", 3.2, 3.2);
hts = Param("slide all",33,-1000,1000,1);
 
 
{
if(ppl==1) {
Plot(pd,"",colorPink,styleLine|styleDots|styleThick|styleNoRescale);
Plot(sd1,"",colorPink,styleDashed|styleNoRescale);
Plot(sd2,"",colorPink, styleDashed|styleNoRescale);
Plot(sd3,"",colorPink, styleDashed|styleNoRescale);
Plot(sd4,"",colorPink, styleDashed|styleNoRescale);
Plot(sd5,"",colorPink, styleDashed|styleNoRescale);
Plot(rd1,"",colorPink, styleDashed|styleNoRescale);
Plot(rd2,"",colorPink, styleDashed|styleNoRescale);
Plot(rd3,"",colorPink, styleDashed|styleNoRescale);
Plot(rd4,"",colorPink, styleDashed|styleNoRescale);
Plot(rd5,"",colorPink, styleDashed|styleNoRescale);
 
Plot(pw,"",colorGreen,styleLine|styleDots|styleThick|styleNoRescale);
Plot(sw1,"",colorDarkGreen, styleDashed|styleNoRescale);
Plot(sw2,"",colorDarkGreen, styleDashed|styleNoRescale);
Plot(sw3,"",colorDarkGreen, styleDashed|styleNoRescale);
Plot(sw4,"",colorDarkGreen, styleDashed|styleNoRescale);
Plot(rw1,"",colorDarkGreen, styleDashed|styleNoRescale);
Plot(rw2,"",colorDarkGreen, styleDashed|styleNoRescale);
Plot(rw3,"",colorDarkGreen, styleDashed|styleNoRescale);
Plot(rw4,"",colorDarkGreen, styleDashed|styleNoRescale);
 
 
Plot(pm,"",colorViolet,styleLine|styleDots|styleThick|styleNoRescale);
Plot(sm1,"",colorViolet, styleDashed|styleNoRescale);
Plot(sm2,"",colorViolet, styleDashed|styleNoRescale);
Plot(sm3,"",colorViolet, styleDashed|styleNoRescale);
Plot(rm1,"",colorViolet, styleDashed|styleNoRescale);
Plot(rm2,"",colorViolet, styleDashed|styleNoRescale);
Plot(rm3,"",colorViolet, styleDashed|styleNoRescale);
 
i=1;
 
PlotText(" D-PVT = " + WriteVal(pd,fraction), LastValue(BarIndex())-(numbars/Hts), dp, colorPink);
PlotText(" DR1 = " + WriteVal(rd1,fraction), LastValue(BarIndex())-(numbars/Hts), rd1 , colorPink);
PlotText(" DS1 = " + WriteVal(sd1,fraction), LastValue(BarIndex())-(numbars/Hts), sd1 , colorPink);
PlotText(" DR2 = " + WriteVal(rd2,fraction), LastValue(BarIndex())-(numbars/Hts), rd2 , colorPink);
PlotText(" DS2 = " + WriteVal(sd2,fraction), LastValue(BarIndex())-(numbars/Hts), sd2 , colorPink);
PlotText(" DR3 = " + WriteVal(rd3,fraction), LastValue(BarIndex())-(numbars/Hts), rd3 , colorPink);
PlotText(" DS3 = " + WriteVal(sd3,fraction), LastValue(BarIndex())-(numbars/Hts), sd3 , colorPink);
PlotText(" DR4 = " + WriteVal(rd4,fraction), LastValue(BarIndex())-(numbars/Hts), rd4 , colorPink);
PlotText(" DS4 = " + WriteVal(sd4,fraction), LastValue(BarIndex())-(numbars/Hts), sd4 , colorPink);
PlotText(" DR5 = " + WriteVal(rd4,fraction), LastValue(BarIndex())-(numbars/Hts), rd5 , colorPink);
PlotText(" DS5 = " + WriteVal(sd4,fraction), LastValue(BarIndex())-(numbars/Hts), sd5 , colorPink);
 
PlotText(" W-PVT = " + WriteVal(pw,fraction), LastValue(BarIndex())-(numbars/Hts), pw , colorGreen);
 
PlotText(" WR1 = " + WriteVal(rw1,fraction), LastValue(BarIndex())-(numbars/Hts), rw1 , colorGreen);
PlotText(" WS1 = " + WriteVal(sw1,fraction), LastValue(BarIndex())-(numbars/Hts), sw1 , colorGreen);
PlotText(" WR2 = " + WriteVal(rw2,fraction), LastValue(BarIndex())-(numbars/Hts), rw2 , colorGreen);
PlotText(" WS2 = " + WriteVal(sw2,fraction), LastValue(BarIndex())-(numbars/Hts), sw2 , colorGreen);
PlotText(" WR3 = " + WriteVal(rw3,fraction), LastValue(BarIndex())-(numbars/Hts), rw3 , colorGreen);
PlotText(" WS3 = " + WriteVal(sw3,fraction), LastValue(BarIndex())-(numbars/Hts), sw3 , colorGreen);
PlotText(" WR4 = " + WriteVal(rw4,fraction), LastValue(BarIndex())-(numbars/Hts), rw4 , colorGreen);
PlotText(" WS4 = " + WriteVal(sw4,fraction), LastValue(BarIndex())-(numbars/Hts), sw4 , colorGreen);
 
PlotText(" M-PVT = " + WriteVal(pm,fraction), LastValue(BarIndex())-(numbars/Hts), pm , colorViolet);
 
PlotText(" MR1 = " + WriteVal(rm1,fraction), LastValue(BarIndex())-(numbars/Hts), rm1 ,colorViolet );
PlotText(" MS1 = " + WriteVal(sm1,fraction), LastValue(BarIndex())-(numbars/Hts), sm1 ,colorViolet );
PlotText(" MR2 = " + WriteVal(rm2,fraction), LastValue(BarIndex())-(numbars/Hts), rm2 ,colorViolet);
PlotText(" MS2 = " + WriteVal(sm2,fraction), LastValue(BarIndex())-(numbars/Hts), sm2 , colorViolet);
PlotText(" MR3 = " + WriteVal(rm3,fraction), LastValue(BarIndex())-(numbars/Hts), rm3 , colorViolet);
PlotText(" MS3 = " + WriteVal(sm3,fraction), LastValue(BarIndex())-(numbars/Hts), sm3 , colorViolet);
 
}}
 
//--end----------------------------------------------------------------------------
_SECTION_END();
 
/*--------------------------------------*/
 
// TEXT
"high  = "+H;
"low   = "+L;
"close = "+C;
 
_SECTION_BEGIN("ATP");
Atp=ParamToggle("ATP","Off|On",1);
if(Atp==1)
{
 
 
DayChange = Day() != Ref(Day(), -1);
AvgTradePrice = Null;
CurDayBars = 0;
CurDayCloseSum = 0;
 
for (i = 0; i < BarCount; i++)
{
if (DayChange[i])
{
CurDayCloseSum = C[i];
CurDayBars = 1;
}
else
{
CurDayCloseSum = CurDayCloseSum + C[i];
CurDayBars++;
}
AvgTradePrice[i] = CurDayCloseSum / CurDayBars;
}
Plot(AvgTradePrice, "AvgTradePrice",colorDarkGrey,styleThick);
ATP=AvgTradePrice;
 
_SECTION_END();}


_SECTION_BEGIN("Title");
if( Status("action") == actionIndicator )
(
Title = EncodeColor(colorWhite)+ " Pivot Chart" + " - " +  Name() + " - " + EncodeColor(colorBrightGreen)+ Interval(2) + EncodeColor(colorWhite) +
 "  - " + Date() +" - "+"  "+EncodeColor(colorWhite) +"Op-"+O+"  "+"Hi-"+H+"  "+"Lo-"+L+" "+
"Cl-"+C+"  "+ "Vol= "+ WriteVal(V)+ " :: "+EncodeColor(ColorRGB(140,140,140)) + "ATP: "+ATP+"\n" + EncodeColor(ColorRGB(175,90,59)) + "DR1="+rd1+"   "+"DR2="+rd2+"   "+"DR3="+rd3+"   "+"DR4="+rd4+"   "+"DR5="+rd5+"  "+EncodeColor(colorGold) +  "D-Pivot ="+pd+"\n"+
EncodeColor(ColorRGB(73,123,201)) + "DS1="+sd1+"   "+"DS2="+sd2+"   "+"DS3="+sd3+"   "+"DS4="+sd4+"   "+"DS5="+sd5+"\n"+
EncodeColor(colorOrange) + "WR1="+rw1+"   "+"WR2="+rw2+"   "+"WR3="+rw3+"   "+"WR4="+rw4+"   "+EncodeColor(colorYellow) + "W-Pivot = "+pw+"\n"+
EncodeColor(ColorRGB(9,128,250)) + "WS1="+sw1+"   "+"WS2="+sw2+"   "+"WS3="+sw3+"   "+"WS4="+sw4+"\n"+
EncodeColor(ColorRGB(175,96,175)) + "MR1="+rm1+"   "+"MR2="+rm2+"   "+"MR3="+rm3+"  "+EncodeColor(colorYellow) +   "M-Pivot = "+pm+"\n"+
EncodeColor(ColorRGB(25,25,255))  + "MS1="+sm1+"  "+"MS2="+sm2+"   "+"MS3="+sm3);
 
_SECTION_END();
 
 
fsma=ParamToggle("Moving Avg","Off|On",0);
 
if(fsma==1)
{
 
_SECTION_BEGIN("UL");
Periods = Param("periods", 34, 2, 300, 1, 10 );
Plot( EMA(High, Periods ),_DEFAULT_NAME(), ColorRGB(25,50,25), styleNoLabel,styleLine);
 
_SECTION_END();
 
_SECTION_BEGIN("LL");
 
Periods = Param("periods", 34, 2, 300, 1, 10 );
Plot( EMA( Low, Periods ),_DEFAULT_NAME(), ColorRGB(50,25,25), styleNoLabel,styleLine);
_SECTION_END();}
 
_SECTION_BEGIN("Cloud Setting");
//Cloud
 
CloudResColor=ParamColor("CloudResColor",ColorRGB(25,33,25));
CR=EMA(H,34);
CS=EMA(L,34);
 
//if(segretribbon == 1)
{
//////////////////////////    PlotOHLC( CS, CS, CR,CR, "Band", CloudResColor, styleCloud | styleNoLabel|styleNoTitle);
}
 
_SECTION_END();
 
 
_SECTION_BEGIN("Display");
Display= ParamToggle("Display","Off|On",1);
if(Display==1)
{
x=Param("xposn",0,0,1000,1);
y=Param("yposn",569,0,1000,1);
 
GfxSetBkColor(ColorRGB(23,25,23));
GfxSelectFont( "Times New Roman",9,500, True);
GfxSetTextColor( colorGrey40);  
GfxTextOut("RSI: "+WriteVal(RSI(14),1.0)+" | MACD:  "+WriteVal(MACD(),1.2)+" | F(Ema): "+NumToStr(EMA(C,5),1.2)+" |9(Ema): "+NumToStr(EMA(C,9),1.2)+"
|15(EMA): "+NumToStr(EMA(C,15),1.2)+" |30(EMA): "+NumToStr(EMA(C,30),1.2)+" |50(EMA): "+NumToStr (EMA(C,50),1.2), x, y );
 
cx=Param("cxposn",537,0,1000,1);
cy=Param("cyposn",12,0,1000,1);
 
GfxSetBkColor(ColorRGB(23,25,23));
GfxSelectFont( "Bodoni MT",14,50, False);
GfxSetTextColor( colorWhite);  
GfxTextOut("LTP: "+C+" ", cx, cy );
 _SECTION_END();}


_SECTION_BEGIN("Background Color");
BKswitch = ParamToggle("Background Color","On,Off");
 
OUTcolor = ParamColor("Outer Panel Color",ColorRGB(25,25,25));
INUPcolor = ParamColor("Inner Panel Upper",ColorRGB(23,25,23));
INDNcolor = ParamColor("Inner Panel Lower",ColorRGB(23,25,23));
TitleColor = ParamColor("Title Color ",ColorRGB(23,25,23));
 
if (NOT BKswitch)
{
SetChartBkColor(OUTcolor); // color of outer border
SetChartBkGradientFill(INUPcolor,INDNcolor,TitleColor); // color of inner panel
} 


4 comments

1. tigernifty

thank you for ur AFL, my rating star is 4 star.

2. esnataraj

Duplicate in my Afl Natraj Pivot Chart with some modification.

3. saleh ail

_SECTION_BEGIN ( "الأسعار")؛
SetChartOptions (0، chartShowArrows | chartShowDates)؛
_N (Title = StrFormat ("{{NAME}} - {{INTERVAL}} {{DATE}} Open٪ g، Hi٪ g، Lo٪ g، Close٪ g (٪ .1f ٪٪) {{VALUES}} "، O، H، L، C، SelectedValue (ROC (C، 1))))؛
Plot (C، "Close"، ParamColor ("Color"، colorBlack)، styleNoTitle | ParamStyle ("Style") | GetPriceStyle ())؛ 
_SECTION_END ()؛


_SECTION_BEGIN ("Ramesh.SR Pivot Chart") ؛
_SECTION_BEGIN ( "XTL")؛

SetChartBkColor (ParamColor ("لون اللوحة الخارجي" ، colorLightGrey))؛
tgt = 37؛
أ = CCI (20) <-tgt؛
b = CCI (20)> tgt؛
state = IIf (a> b، -1، IIf (a == b، 0،1))؛
اللون = IIf (حالة == 0 ، colorBlue ، IIf (حالة == 1 ، colorGreen ، IIf (الحالة == -1 ، colorRed ، 0)))؛

// Plot (state، ""، color، styleHistogram)؛

// SetChartOptions (0، chartShowDates | chartShowArrows | chartLogarithmic | chartWrapTitle)؛
// _ N (العنوان = StrFormat ("{{NAME}} - {{INTERVAL}} {{DATE}} افتح٪ g ، و٪ g ،٪ Lo٪ g ، أغلق٪ g (٪ .1f ٪٪) {{VALUES }} "، O، H، L، C، SelectedValue (ROC (C، 1))))؛
// Plot (C، "Close"، color، styleNoTitle | styleBar | styleThick)؛
 

  _SECTION_BEGIN ("Ramesh Swing") ؛
// حقوق الطبع والنشر Kamalesh Langote. البريد الإلكتروني: rameshram_isp@yahoo.co.in. مزيد من التفاصيل في http://niftyhitech.blogspot.com/
// Save index as "ramesh.afl" in C: program files> Amibroker> Formulas> Custom folder and drap and drop on price price
no = Param ("Swing"، 20، 1، 55)؛
tsl_col = ParamColor ("Color"، colorCycle)؛

الدقة = HHV (H، لا)؛
سوب = LLV (L، لا)؛
AVD = معهد التمويل الدولي (C> المرجع (احتياط، -1)، 1، معهد التمويل الدولي (C <المرجع (سوب، -1)، - 1،0))؛
(! AVD = 0، AVD، 1) = AVN ValueWhen.
TSL = معهد التمويل الدولي (AVN == 1، سوب، الدقة)؛

// Plot (tsl، _DEFAULT_NAME ()، tsl_col، styleThick | styleThick)؛ // أو styleaArea

Plot (tsl، _DEFAULT_NAME ()، tsl_col، styleThick | styleStaircase)؛ // أو styleaArea


يبيع = الصليب (C، TSL)؛
بيع = الصليب (TSL، C).
PlotShapes (IIf (Buy، shapeSquare، shapeNone)، colorGreen، 0، L، Offset = -40)؛
PlotShapes (IIf (Buy، shapeSquare، shapeNone)، colorLime، 0، L، Offset = -50)؛                      
PlotShapes (IIf (Buy، shapeUpArrow، shapeNone)، colorWhite، 0، L، Offset = -45)؛
PlotShapes (IIf (Sell، shapeSquare، shapeNone)، colorRed، 0، H، Offset = 40)؛
PlotShapes (IIf (Sell، shapeSquare، shapeNone)، colorOrange، 0، H، Offset = 50)؛                      
PlotShapes (IIf (Sell، shapeDownArrow، shapeNone)، colorWhite، 0، H، Offset = -45)؛

_SECTION_END ()؛

_SECTION_BEGIN ("pivots mw")؛
SetChartBkColor (2)؛
k = IIf (ParamList ("select select"، "daily | next day") == "daily"، - 1،0)؛
K1 = -1.
TimeFrameSet (inDaily)؛
day_h = LastValue (Ref (H، K))؛
day_l = LastValue (Ref (L، K))؛
day_c = LastValue (Ref (C، K))؛
TimeFrameRestore ()؛
 
TimeFrameSet (inWeekly)؛
Week_h = LastValue (Ref (H، K1))؛
Week_l = LastValue (Ref (L، K1)) ؛؛
Week_c = LastValue (Ref (C، K1)) ؛؛
TimeFrameRestore ()؛
 
TimeFrameSet (inMonthly)؛
month_h = LastValue (Ref (H، K1))؛
month_l = LastValue (Ref (L، K1))؛
month_c = LastValue (Ref (C، K1))؛
TimeFrameRestore ()؛
 
/ * -------------------------------------- * /
// يوم
DH = Day_h.
DL = Day_L.
DC = Day_C.
 
// DAY PIVOT حساب
pd = (DH + DL + DC) / 3؛
sd1 = (2 * pd) -DH؛
sd2 = pd - (DH - DL)؛
sd3 = Sd1 - (DH-DL)؛
sd4 = Sd2 - (DH-DL)؛
sd5 = Sd3 - (DH-DL)؛
rd1 = (2 * pd) -DL؛
rd2 = pd + (DH -DL)؛
rd3 = rd1 + (DH-DL) ؛
rd4 = rd2 + (DH-DL)؛
rd5 = rd3 + (DH-DL)؛
موانئ دبي = المشتريات.
// أسبوع
WH = Week_h.
WL = Week_l.
WC = Week_c.
 
// WEEK PIVOT حساب
pw = (WH + WL + WC) / 3؛
sw1 = (2 * pw) -WH؛
sw2 = pw - (WH - WL)؛
sw3 = Sw1 - (WH-WL)؛
sw4 = Sw2 - (WH-WL)؛
rw1 = (2 * pw) -WL؛
rw2 = pw + (WH -WL)؛
rw3 = rw1 + (WH-WL)؛
rw4 = rw2 + (WH-WL)؛
 
 
// الشهر
MH = month_h.
ML = month_l.
MC = month_c.
 
// MONTH PIVOT حساب
pm = (MH + ML + MC) / 3؛
sm1 = (2 * pm) -MH؛
sm2 = pm - (MH - ML)؛
sm3 = SM1 - (MH-ML) ؛
rm1 = (2 * pm) -ML ؛
rm2 = pm + (MH -ML)؛
rm3 = rm1 + (MH-ML) ؛
 
ppl = ParamToggle ("Plot Pivot Levels"، "Off | On"، 1)؛
numbars = LastValue (Cum (Status ("barvisible")))؛
fraction = IIf (StrRight (Name ()، 3) == ""، 3.2، 3.2)؛
hts = Param ("slide all"، 33، -1000،1000،1)؛
 
 
{
if (ppl == 1) {
مؤامرة (PD، ""، colorPink، styleLine | styleDots | styleThick | styleNoRescale)؛
مؤامرة (SD1، ""، colorPink، styleDashed | styleNoRescale)؛
Plot (sd2، ""، colorPink، styleDashed | styleNoRescale)؛
Plot (sd3، ""، colorPink، styleDashed | styleNoRescale)؛
Plot (sd4، ""، colorPink، styleDashed | styleNoRescale)؛
Plot (sd5، ""، colorPink، styleDashed | styleNoRescale)؛
Plot (rd1، ""، colorPink، styleDashed | styleNoRescale)؛
Plot (rd2، ""، colorPink، styleDashed | styleNoRescale)؛
Plot (rd3، ""، colorPink، styleDashed | styleNoRescale)؛
Plot (rd4، ""، colorPink، styleDashed | styleNoRescale)؛
Plot (rd5، ""، colorPink، styleDashed | styleNoRescale)؛
 
مؤامرة (PW، ""، colorGreen، styleLine | styleDots | styleThick | styleNoRescale)؛
Plot (sw1، ""، colorDarkGreen، styleDashed | styleNoRescale)؛
Plot (sw2، ""، colorDarkGreen، styleDashed | styleNoRescale)؛
Plot (sw3، ""، colorDarkGreen، styleDashed | styleNoRescale)؛
Plot (sw4، ""، colorDarkGreen، styleDashed | styleNoRescale)؛
Plot (rw1، ""، colorDarkGreen، styleDashed | styleNoRescale)؛
Plot (rw2، ""، colorDarkGreen، styleDashed | styleNoRescale)؛
Plot (rw3، ""، colorDarkGreen، styleDashed | styleNoRescale)؛
Plot (rw4، ""، colorDarkGreen، styleDashed | styleNoRescale)؛
 
 
مؤامرة (بعد الظهر، ""، colorViolet، styleLine | styleDots | styleThick | styleNoRescale)؛
Plot (sm1، ""، colorViolet، styleDashed | styleNoRescale)؛
Plot (sm2، ""، colorViolet، styleDashed | styleNoRescale)؛
Plot (sm3، ""، colorViolet، styleDashed | styleNoRescale)؛
Plot (rm1، ""، colorViolet، styleDashed | styleNoRescale)؛
Plot (rm2، ""، colorViolet، styleDashed | styleNoRescale)؛
Plot (rm3، ""، colorViolet، styleDashed | styleNoRescale)؛
 
ط = 1؛
 
PlotText ("D-PVT =" + WriteVal (pd، fraction)، LastValue (BarIndex ()) - (numbars / Hts)، dp، colorPink)؛
PlotText ("DR1 =" + WriteVal (rd1 ، كسر) ، LastValue (BarIndex ()) - (numbars / Hts) ، rd1 ، colorPink) ؛
PlotText ("DS1 =" + WriteVal (sd1 ، كسر) ، LastValue (BarIndex ()) - (numbars / Hts) ، sd1 ، colorPink) ؛
PlotText ("DR2 =" + WriteVal (rd2 ، كسر) ، LastValue (BarIndex ()) - (numbars / Hts) ، rd2 ، colorPink) ؛
PlotText ("DS2 =" + WriteVal (sd2 ، كسر) ، LastValue (BarIndex ()) - (numbars / Hts) ، sd2 ، colorPink) ؛
PlotText ("DR3 =" + WriteVal (rd3، fraction)، LastValue (BarIndex ()) - (numbars / Hts)، rd3، colorPink)؛
PlotText ("DS3 =" + WriteVal (sd3 ، كسر) ، LastValue (BarIndex ()) - (numbars / Hts) ، sd3 ، colorPink) ؛
PlotText ("DR4 =" + WriteVal (rd4 ، كسر) ، LastValue (BarIndex ()) - (numbars / Hts) ، rd4 ، colorPink) ؛
PlotText ("DS4 =" + WriteVal (sd4 ، كسر) ، LastValue (BarIndex ()) - (numbars / Hts) ، sd4 ، colorPink) ؛
PlotText ("DR5 =" + WriteVal (rd4 ، كسر) ، LastValue (BarIndex ()) - (numbars / Hts) ، rd5 ، colorPink) ؛
PlotText ("DS5 =" + WriteVal (sd4 ، كسر) ، LastValue (BarIndex ()) - (numbars / Hts) ، sd5 ، colorPink) ؛
 
PlotText ("W-PVT =" + WriteVal (pw، fraction)، LastValue (BarIndex ()) - (numbars / Hts)، pw، colorGreen)؛
 
PlotText ("WR1 =" + WriteVal (rw1، fraction)، LastValue (BarIndex ()) - (numbars / Hts)، rw1، colorGreen)؛
PlotText ("WS1 =" + WriteVal (sw1 ، كسر) ، LastValue (BarIndex ()) - (numbars / Hts) ، sw1 ، colorGreen) ؛
PlotText ("WR2 =" + WriteVal (rw2، fraction)، LastValue (BarIndex ()) - (numbars / Hts)، rw2، colorGreen)؛
PlotText ("WS2 =" + WriteVal (sw2 ، كسر) ، LastValue (BarIndex ()) - (numbars / Hts) ، sw2 ، colorGreen) ؛
PlotText ("WR3 =" + WriteVal (rw3، fraction)، LastValue (BarIndex ()) - (numbars / Hts)، rw3، colorGreen)؛
PlotText ("WS3 =" + WriteVal (sw3 ، كسر) ، LastValue (BarIndex ()) - (numbars / Hts) ، sw3 ، colorGreen) ؛
PlotText ("WR4 =" + WriteVal (rw4، fraction)، LastValue (BarIndex ()) - (numbars / Hts)، rw4، colorGreen)؛
PlotText ("WS4 =" + WriteVal (sw4 ، كسر) ، LastValue (BarIndex ()) - (numbars / Hts) ، sw4 ، colorGreen) ؛
 
PlotText ("M-PVT =" + WriteVal (pm، fraction)، LastValue (BarIndex ()) - (numbars / Hts)، pm، colorViolet)؛
 
PlotText ("MR1 =" + WriteVal (rm1، fraction)، LastValue (BarIndex ()) - (numbars / Hts)، rm1، colorViolet)؛
PlotText ("MS1 =" + WriteVal (sm1، fraction)، LastValue (BarIndex ()) - (numbars / Hts)، sm1، colorViolet)؛
PlotText ("MR2 =" + WriteVal (rm2، fraction)، LastValue (BarIndex ()) - (numbars / Hts)، rm2، colorViolet)؛
PlotText ("MS2 =" + WriteVal (sm2، fraction)، LastValue (BarIndex ()) - (numbars / Hts)، sm2، colorViolet)؛
PlotText ("MR3 =" + WriteVal (rm3، fraction)، LastValue (BarIndex ()) - (numbars / Hts)، rm3، colorViolet)؛
PlotText ("MS3 =" + WriteVal (sm3، fraction)، LastValue (BarIndex ()) - (numbars / Hts)، sm3، colorViolet)؛
 
}}
 
//--النهاية--------------------------------------------- -------------------------------
_SECTION_END ()؛
 
/ * -------------------------------------- * /
 
// TEXT
"high =" + H؛
"low =" + L؛
"close =" + C؛
 
_SECTION_BEGIN ( "ATP")؛
ATP = ParamToggle ( "ATP"، "إيقاف | على"، 1)؛
إذا (ATP == 1)
{
 
 
DayChange = يوم ()! = Ref (يوم () ، -1)؛
AvgTradePrice = Null؛
CurDayBars = 0؛
CurDayCloseSum = 0؛
 
لـ (i = 0؛ i <BarCount؛ i ++)
{
إذا (DayChange [i])
{
CurDayCloseSum = C [i]؛
CurDayBars = 1؛
}
آخر
{
CurDayCloseSum = CurDayCloseSum + C [i]؛
CurDayBars ++؛
}
AvgTradePrice [i] = CurDayCloseSum / CurDayBars؛
}
Plot (AvgTradePrice، "AvgTradePrice"، colorDarkGrey، styleThick)؛
ATP = AvgTradePrice.
 
_SECTION_END ()؛}


_SECTION_BEGIN ( "العنوان")؛
إذا كانت (Status ("action") == actionIndicator)
(
Title = EncodeColor (colorWhite) + "Pivot Chart" + "-" + Name () + "-" + EncodeColor (colorBrightGreen) + Interval (2) + EncodeColor (colorWhite) +
 "-" + Date () + "-" + "" + EncodeColor (colorWhite) + "Op -" + O + "" + "Hi -" + H + "" + "Lo -" + L + "" +
"Cl -" + C + "" + "Vol =" + WriteVal (V) + "::" + EncodeColor (ColorRGB (140،140،140)) + "ATP:" + ATP + "\ n" + EncodeColor (ColorRGB (175،90 ، 59)) + "DR1 =" + rd1 + "" + "DR2 =" + rd2 + "" + "DR3 =" + rd3 + "" + "DR4 =" + rd4 + "" + "DR5 =" + rd5 + "" + EncodeColor (colorGold) + "D-Pivot =" + pd + "\ n" +
EncodeColor (ColorRGB (73،123،201)) + "DS1 =" + sd1 + "" + "DS2 =" + sd2 + "" + "DS3 =" + sd3 + "" + "DS4 =" + sd4 + "" + "DS5 =" + sd5 + "\ ن" +
EncodeColor (colorOrange) + "WR1 =" + rw1 + "" + "WR2 =" + rw2 + "" + "WR3 =" + rw3 + "" + "WR4 =" + rw4 + "" + EncodeColor (colorYellow) + "W-Pivot = "+ pw +" \ n "+
EncodeColor (ColorRGB (9،128،250)) + "WS1 =" + sw1 + "" + "WS2 =" + sw2 + "" + "WS3 =" + sw3 + "" + "WS4 =" + sw4 + "\ n" +
EncodeColor (ColorRGB (175،96،175)) + "MR1 =" + rm1 + "" + "MR2 =" + rm2 + "" + "MR3 =" + rm3 + "" + EncodeColor (colorYellow) + "M-Pivot =" + pm + "\ ن" +
EncodeColor (ColorRGB (25،25،255)) + "MS1 =" + sm1 + "" + "MS2 =" + sm2 + "" + "MS3 =" + sm3)؛
 
_SECTION_END ()؛
 
 
fsma = ParamToggle ("Moving Avg"، "Off | On"، 0)؛
 
إذا (FSMA == 1)
{
 
_SECTION_BEGIN ( "UL")؛
Periods = Param ("period"، 34، 2، 300، 1، 10)؛
رسم (EMA (عالي ، Periods) ، _ DEFAULT_NAME () ، ColorRGB (25،50،25) ، styleNoLabel ، styleLine)؛
 
_SECTION_END ()؛
 
_SECTION_BEGIN ( "LL")؛
 
Periods = Param ("period"، 34، 2، 300، 1، 10)؛
Plot (EMA (Low، Periods)، _ DEFAULT_NAME ()، ColorRGB (50،25،25)، styleNoLabel، styleLine)؛
_SECTION_END ()؛}
 
_SECTION_BEGIN ("إعداد السحابة") ؛
//غيم
 
CloudResColor = ParamColor ( "CloudResColor"، ColorRGB (25،33،25))؛
CR = EMA (H، 34)؛
CS = EMA (L، 34)؛
 
// if (segretribbon == 1)
{
////////////////////////// PlotOHLC (CS، CS، CR، CR، "Band"، CloudResColor، styleCloud | styleNoLabel | styleNoTitle)؛
}
 
_SECTION_END ()؛
 
 
_SECTION_BEGIN ( "العرض")؛
العرض = ParamToggle ("Display"، "Off | On"، 1)؛
إذا (العرض == 1)
{
س = بارام ( "xposn"، 0،0،1000،1)؛
ذ = بارام ( "yposn"، 569،0،1000،1)؛
 
GfxSetBkColor (ColorRGB (23،25،23))؛
GfxSelectFont ("Times New Roman"، 9،500، True)؛
GfxSetTextColor (colorGrey40)؛  
GfxTextOut ("RSI:" + WriteVal (RSI (14)، 1.0) + "| MACD:" + WriteVal (MACD ()، 1.2) + "| F (Ema):" + NumToStr (EMA (C، 5)، 1.2) + "| 9 (Ema):" + NumToStr (EMA (C، 9)، 1.2) + "
| 15 (EMA): "+ NumToStr (EMA (C، 15)، 1.2) +" | 30 (EMA): "+ NumToStr (EMA (C، 30)، 1.2) +" | 50 (EMA): "+ NumToStr (EMA (C، 50)، 1.2)، x، y)؛
 
CX = بارام ( "cxposn"، 537،0،1000،1)؛
قبرصي = بارام ( "cyposn"، 12،0،1000،1)؛
 
GfxSetBkColor (ColorRGB (23،25،23))؛
GfxSelectFont ("Bodoni MT"، 14،50، False)؛
GfxSetTextColor (colorWhite)؛  
GfxTextOut ("LTP:" + C + ""، cx، cy)؛
 _SECTION_END ()؛}


_SECTION_BEGIN ("لون الخلفية") ؛
BKswitch = ParamToggle ("لون الخلفية" ، "تشغيل ، إيقاف") ؛
 
OUTcolor = ParamColor ("لون اللوحة الخارجي" ، ColorRGB (25،25،25))؛
INUPcolor = ParamColor ("Inner Panel Upper"، ColorRGB (23،25،23))؛
INDNcolor = ParamColor ("Inner Panel Lower"، ColorRGB (23،25،23))؛
TitleColor = ParamColor ("Title Color"، ColorRGB (23،25،23))؛
 
إذا (لا BKswitch)
{
SetChartBkColor (OUTcolor)؛ // لون الحدود الخارجية
SetChartBkGradientFill (INUPcolor، INDNcolor، TitleColor)؛ // لون اللوحة الداخلية
} 


4. parfumeur

Dear Saleh – I’m confused by your last comment code, non afl syntax. If indeed valid afl code, could you post the code under [Indicators] > [Paste Bin] or Indicator Pasties. The proper formatting for the afl would be preserves, and maybe add a comment for your post within the code between /* ….. relevant comment ….. */ at the head of the code???? Thank you for your due diligence.

Leave Comment

Please login here to leave a comment.

Back