Flower Indicator for Amibroker (AFL)
niladri over 14 years ago Amibroker (AFL)
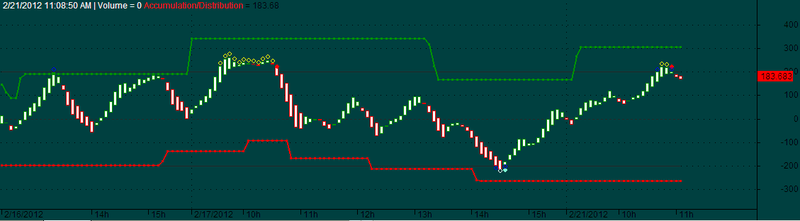
Dear Members,
Please use the following AFL on your exisitng AMIBROKER Chart & get a edge in identifying Accumulation/Distribution zone of any market.
Each levels can act like support & resistance ( watch for +/- 200 levels & the dots when appear on the chart )
Title of the Flower Chart will go RED if we are entering in a Distribution phase & Green for Accumulation.
This is a modified RENKO chart & should be used with MPLITE & any Momentum indicator combination for best results.
Screenshots
Indicator / Formula
Copy & Paste Friendly
_SECTION_BEGIN("Price");
SetChartOptions(0,chartShowArrows|chartShowDates);
SetBarsRequired(sbrAll,sbrAll);
SetChartBkColor(ParamColor("Outer panel",colorDarkOliveGreen));
GraphXSpace=Param("GraphXSpace",20,-10,25,1);
_SECTION_END();

_SECTION_BEGIN( "Flower" );
Title = StrFormat( "\\c02 {{DATE}} | Volume = " + WriteVal( V, 1.0 ) + " {{VALUES}}", O, H, L, C, SelectedValue( ROC( C, 1 ) ) );
_SECTION_END();

_SECTION_BEGIN( "Sup/Res Detail" );
SupResPeriod = Param( "LookBack Period", 50, 0, 200, 1 );
SupResPercentage = Param( "Percentage", 100, 0, 200, 1 );
PricePeriod = Param( "Price Period", 16, 0, 200, 1 );
SupportLinecolor = ParamColor( "Support Color", colorGreen );
SupportLinestyle = ParamStyle( "Support Style", styleThick | 8 | styleNoLabel );
ResistanceLinecolor = ParamColor( "Resistance Color", colorRed );
Resistancestyle = ParamStyle( "Resistance Style", styleThick | 8 | styleNoLabel );
_SECTION_END();

_SECTION_BEGIN( "Line Detail" );
OverBought = Param( "OverBought Above", 200, 0, 400, 1 );
OverSold = Param( "OverSold Bellow", -200, -400, 0, 1 );
_SECTION_END();

_SECTION_BEGIN( "Trend Bought/Sold Detail" );
Smoother = Param( "Trend Smoother", 5, 5, 20 );
upcolor = ParamColor( "UpTrend Color", colorGreen );
Downcolor = ParamColor( "DownTrend Color", colorRed );
_SECTION_END();

_SECTION_BEGIN( "Circle Detail" );
Warningcolor = ParamColor( "Warning/Watch Signal", colorBlue );
WatchColor = ParamColor( "Accumulation Zone", colorWhite );
EntryColor = ParamColor( "Entry Signal", colorAqua );
ProfitTakeColor = ParamColor( "Distribution Zone", colorYellow );
ExitColor = ParamColor( "Exit Signal", colorRed );
_SECTION_END();

_SECTION_BEGIN( "Swing Sup/Res" );
Lookback = SupResPeriod;
PerCent = SupResPercentage;
Pds = PricePeriod;
Var = MACD();
Up = IIf( Var > Ref( Var, -1 ), abs( Var - Ref( Var, -1 ) ), 0 );
Dn = IIf( Var < Ref( Var, -1 ), abs( Var - Ref( Var, -1 ) ), 0 );
Ut = Wilders( Up, Pds );
Dt = Wilders( Dn, Pds );
RSIt = 100 * ( Ut / ( Ut + Dt ) );
A1 = RSIt;
B2 = RSI( pds );
C3 = CCI( pds );
D4 = StochK( pds );
E5 = StochD( pds );
F6 = MFI( pds );
G7 = Ultimate( pds );
H8 = ROC( C, pds );
Osc = C3;
Value1 = Osc;
Value2 = HHV( Value1, Lookback );
Value3 = LLV( Value1, Lookback );
Value4 = Value2 - Value3;
Value5 = Value4 * ( PerCent / 100 );
ResistanceLine = Value3 + Value5;
SupportLine = Value2 - Value5;
baseline = IIf( Osc < 100 AND Osc > 10 , 50 , IIf( Osc < 0 , 0, 0 ) );
Plot( ResistanceLine, "", SupportLinecolor, SupportLinestyle );
Plot( SupportLine, "", ResistanceLinecolor, Resistancestyle );
_SECTION_END();

_SECTION_BEGIN( "Entry/Exit Detail" );
n = Smoother;
ys1 = ( High + Low + Close * 2 ) / 4;
rk3 = EMA( ys1, n );
rk4 = StDev( ys1, n );
rk5 = ( ys1 - rk3 ) * 200 / rk4;
rk6 = EMA( rk5, n );
UP = EMA( rk6, n );
DOWN = EMA( up, n );
Oo = IIf( up < down, up, down );
Hh = Oo;
Ll = IIf( up < down, down, up );
Cc = Ll;
barcolor2 = IIf( Ref( oo, -1 ) < Oo AND Cc < Ref( Cc, -1 ), upcolor, IIf( up > down, upcolor, downcolor ) );
PlotOHLC( Oo, hh, ll, Cc, "Accumulation/Distribution", barcolor2, styleCandle );  // When value is -ve it is accumulation, when +ve it is distribution ( 200 lines are limtits to watch )
Buy = Cross( up, OverSold );
Sell = Cross( OverBought, up );
PlotShapes ( IIf( Buy, shapeSmallCircle, shapeNone ) , EntryColor, layer = 0, yposition = -220, offset = 1 );
PlotShapes ( IIf( Sell, shapeSmallCircle, shapeNone ) , ExitColor, layer = 0, yposition = 220, offset = 1 );
_SECTION_END();

_SECTION_BEGIN( "Overbought/Oversold/Warning Detail" );
n = Smoother;
ys1 = ( High + Low + Close * 2 ) / 4;
rk3 = EMA( ys1, n );
rk4 = StDev( ys1, n );
rk5 = ( ys1 - rk3 ) * 210 / rk4;
rk6 = EMA( rk5, n );
UP = EMA( rk6, n );
DOWN = EMA( up, n );
Oo = IIf( up < down, up, down );
Hh = Oo;
Ll = IIf( up < down, down, up );
Cc = Ll;
barcolor2 = IIf( Ref( oo, -1 ) < Oo AND Cc < Ref( Cc, -1 ), colorGreen, IIf( up > down, colorGreen, colorRed ) );
PlotOHLC( Oo, hh, ll, Cc, "", barcolor2, styleCandle | stylehidden );
UP = EMA( rk6, n );
UPshape = IIf( UP >= OverBought OR UP <= OverSold, shapeHollowSmallCircle, shapeNone );
UPColor = IIf( UP >= 210, ProfitTakeColor, IIf( UP <= -210, WatchColor, Warningcolor ) );
Plot( UP, "", colorGrey50, styleThick | stylehidden );
PlotShapes( UPShape, UPColor, 0, UP, 0 );
_SECTION_END();

_SECTION_BEGIN( "Plot Lines" );
Plot( OverBought, "", colorDarkGrey, styleLine | styleNoLabel );
Plot( 0, "", colorDarkGrey, styleDashed | styleNoLabel );
Plot( OverSold, "", colorDarkGrey, styleLine | styleNoLabel );
_SECTION_END();
15 comments
Leave Comment
Please login here to leave a comment.
Observations so far, Zero Line of this indicator is a potential reversal zone…if a RENKO candles breaches this line comfortably…trend is held till it get’s 100 or 200 levels.
There is not much documentation abt this indicator on google…but this is what I could find on this after watching it live on 5M / 15M chart.
re-posted. You can find the exactly same formula in here. Its name is Matrix Series. I’ve been using it for while, and I think this is a good indicator. Eventhough it is prepared for accumulation/distribution recognizing phase, but based on my observations, it shows when the trend begin getting stronger.
There’re 3 ways to use it. I usually get entry position when :
1. Candle upward before / after cross the zero line
2. Candle downward but real candle is sideways. This will be best when price is in oversold area.
3. Candle downward and begin to change from big to small. It is usually followed by significant movement.
When down candle with the red real candle is occur, it almost certainly bearish signal.
FYI, I use it in daily chart.
Sebaiknya indikator ini tidak digunakan sendirian, krn akan memunculkan false signal. Banyak sekali kombinasi dari signal2 yg dimunculkan oleh indikator ini. Yg saya jabarkan di atas itu cuma secuil saja. Jika ada pengalaman lain dalam menggunakan indikator ini, bisa dibagi di sini. Trims.
hi.this indicator not shown price
Halfman,
Thanks for explanation.Very helpfull
Thanks for sharing your code! This one is truly interesting. Try this to combine with my a yet to release (waiting for approval) bollingerline indicator!
Hi. Thanks for sharing ! Really nice one! Do you have more…..?
Really good indicator for knowing trend strength.
It gives confidence for your buy sell system
Thanks for sharing
viswanath
Wow!! What an AFL
Thx a lot.
Brgds
Ravi
Just starting to use Amibroker and found this interesting indicator. I try to use it for short term trades, but on several occasions it indicates: “accumulation/distribution = -1.#J”. What kind of error is this? Can it be corrected?
TX
Same question/problem like “lunazzi”.
Please answer
Thank you
no red or green candle appears
I’m using Amibroker 6.20 and received a error with this AFl:
Error61.
The number of format specifier(s)(%)does not match the number of arguments passed.
Can anyone please help me to solve this?
new Amibroker 6.20.1 do not like the Title format of the code.
Just drop the whole section & keep using it!
Drop this whole section from code :
======== _SECTION_BEGIN( "Flower" ); Title = StrFormat( "\\c02 {{DATE}} | Volume = " + WriteVal( V, 1.0 ) + " {{VALUES}}", O, H, L, C, SelectedValue( ROC( C, 1 ) ) ); _SECTION_END(); ========
Thanks niladri