OPEN INTEREST ( OI ) for Amibroker (AFL)
anandnst almost 14 years ago Amibroker (AFL)
Open Interest u might be getting in all other Softwares like Metastock, ninjatrader, Falcon or spider.
But now while surfing i got it for Amibroker. So i felt to share with u people.
Conditions ::
1 Condition :
Buying Condition – Open Interest Increase + Price Increase
Selling Condition – Open Interest Decrease + Price Decrease
Short covering Condition – open Interest decrease + Price Increase
Fresh short Condition – Open Interest Increase + Price Decrease
Or
2 Condition :
Short = ATP value decreases or idle but Open interest increases
Buy= ATP value increases + Open interest increases
Term ATP = (AVERAGE TRADING PRICE)
(HAVE A GR8 TIME)!
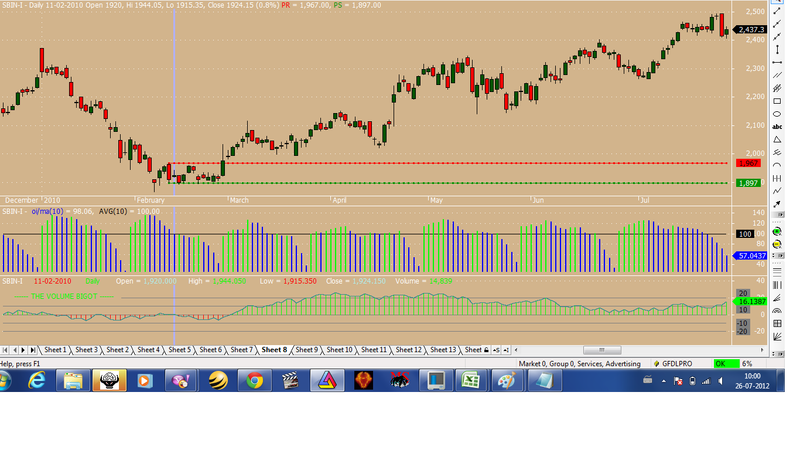
Screenshots
Indicator / Formula
_SECTION_BEGIN("oi");
//Plot( OI, _DEFAULT_NAME(), ParamColor("Color", colorBlueGrey ), ParamStyle( "Style", styleHistogram | styleOwnScale | styleThick, maskHistogram ), 2 );
_SECTION_END();
//written by Thomas Zmuck
//Date: 15-07-02
//thomas.zm@aon.at

pds = 10;
V1 = OI/MA(OI,10); V2 = OI/MA(OI,20);
V3 = OI/MA(OI,50);
x=100*OI/MA(OI,pds);
barcolor =
IIf( x>Ref(x,-1),5,6);
/* Colourized price bars drawn here */
Plot(100*OI/MA(OI,pds)," oi/ma(10)",barcolor,2+4);

Plot(100," AVG(10)",1,1);

unsure = V1<1 AND V2<1 AND V3<1;
sure = V1>1 AND V2>1 AND V3>1;

Filter = unsure;
AddColumn(100*V/MA(V,10),"V/ma(V,10)",1.0);
AddColumn(100*V/MA(V,20),"V/ma(V,20)",1.0);
AddColumn(100*V/MA(V,50),"V/ma(V,50)",1.0);
AddColumn(ROC(C,1),"%today");
5 comments
Leave Comment
Please login here to leave a comment.
Thanks for sharing. All Futures traders must have this to be successful.
Hi,
I have attached this to below price chart. No graph is coming. Am i missing something as this refers to OI.
Thanks
Where is indicator?
It is not appearing…
You must use EOD data ONLY for OI otherwise nothing will be seen as OI historical data needed for calculating the indicator are delivered only EOD and not RT.
no graph is coming