Heikin-Ashi (Koma-Ashi) with Moving Average Type 2 for Amibroker (AFL)
shariful almost 14 years ago Amibroker (AFL)
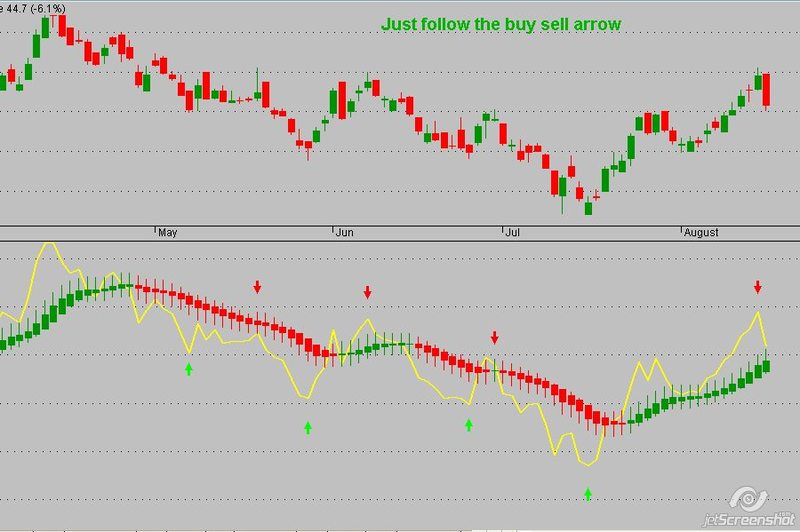
Just follow the buy sell arrow hoping you the guys would enjoy it. It is collected afl seekiing apology to original author for not mentioning his name.
Screenshots
Indicator / Formula
Copy & Paste Friendly
_SECTION_BEGIN("Heikin-Ashi (Koma");
/*
Heikin-Ashi(Koma-Ashi) with Moving Average Type
 */
SetChartOptions(2, chartWrapTitle);
// Calculate Moving Average
MAPeriod = Param("MA Period", 15, 1, 100);
MAOpen = EMA(Open, MAPeriod);
MAHigh = EMA(High, MAPeriod);
MALow = EMA(Low, MAPeriod);
MAClose = EMA(Close, MAPeriod);
HaClose = (MAOpen + MAHigh + MALow + MAClose) / 4;
HaOpen = AMA(Ref(HaClose,  - 1), 0.5);
// for graph collapse
for (i = 0; i <= MAPeriod; i++)
  HaClose[i] = Null;
/*
// same
// HaOpen = (Ref(HaOpen, -1) + Ref(HaClose, -1)) / 2;
HaOpen[ 0 ] = HaClose[ 0 ];
for(i = 1; i < BarCount; i++) {
HaOpen[i] = (HaOpen[i - 1] + HaClose[i - 1]) / 2;
}
 */
HaHigh = Max(MAHigh, Max(HaClose, HaOpen));
HaLow = Min(MALow, Min(HaClose, HaOpen));
// outs comments
"BarIndex = " + BarIndex();
"Open = " + Open;
"High = " + High;
"Low = " + Low;
"Close = " + Close;
"HaOpen = " + HaOpen;
"HaHigh = " + HaHigh;
"HaLow = " + HaLow;
"HaClose = " + HaClose;
// Plot graphs
_N(Title = StrFormat("{{NAME}} - {{INTERVAL}} {{DATE}} HaOpen %g, HaHigh %g, HaLow %g, HaClose %g (%.1f%%) {{VALUES}}", HaOpen, HaHigh, HaLow, HaClose, SelectedValue(ROC(HaClose, 1))));
PlotOHLC(HaOpen, HaHigh, HaLow, HaClose, _DEFAULT_NAME(), ParamColor("Color", colorBlack), styleCandle);
/* **********************************
Code to automatically identify pivots
 ********************************** */
// -- what will be our lookback range for the hh and ll?
farback = Param("How Far back to go", 100, 50, 5000, 10);
nBars = Param("Number of bars", 12, 5, 40);
// -- Title.
Title = Name() + " (" + StrLeft(FullName(), 15) + ") O: " + Open + ", H: " + High + ", L: " + Low + ", C: " + Close;
// -- Plot basic candle chart
PlotOHLC(Open, High, Low, Close, "BIdx = " + BarIndex() + "\n" + "O = " + O + "\n" + "H = " + H + "\n" + "L = " + L + "\n" + "C ", colorYellow, styleLine | styleThick);
GraphXSpace = 7;
// -- Create 0-initialized arrays the size of barcount
aHPivs = H - H;
aLPivs = L - L;
// -- More for future use, not necessary for basic plotting
aHPivHighs = H - H;
aLPivLows = L - L;
aHPivIdxs = H - H;
aLPivIdxs = L - L;
nHPivs = 0;
nLPivs = 0;
lastHPIdx = 0;
lastLPIdx = 0;
lastHPH = 0;
lastLPL = 0;
curPivBarIdx = 0;
// -- looking back from the current bar, how many bars
// back were the hhv and llv values of the previous
// n bars, etc.?
aHHVBars = HHVBars(H, nBars);
aLLVBars = LLVBars(L, nBars);
aHHV = HHV(H, nBars);
aLLV = LLV(L, nBars);
// -- Would like to set this up so pivots are calculated back from
// last visible bar to make it easy to "go back" and see the pivots
// this code would find. However, the first instance of
// _Trace output will show a value of 0
aVisBars = Status("barvisible");
nLastVisBar = LastValue(Highest(IIf(aVisBars, BarIndex(), 0)));
_TRACE("Last visible bar: " + nLastVisBar);
// -- Initialize value of curTrend
curBar = (BarCount - 1);
curTrend = "";
if (aLLVBars[curBar] <
aHHVBars[curBar])
{
  curTrend = "D";
}
else
{
  curTrend = "U";
}
// -- Loop through bars. Search for
// entirely array-based approach
// in future version
for (i = 0; i < farback; i++)
{
  curBar = (BarCount - 1) - i;
  // -- Have we identified a pivot? If trend is down...
  if (aLLVBars[curBar] < aHHVBars[curBar])
  {
    // ... and had been up, this is a trend change
    if (curTrend == "U")
    {
      curTrend = "D";
      // -- Capture pivot information
      curPivBarIdx = curBar - aLLVBars[curBar];
      aLPivs[curPivBarIdx] = 1;
      aLPivLows[nLPivs] = L[curPivBarIdx];
      aLPivIdxs[nLPivs] = curPivBarIdx;
      nLPivs++;
    }
    // -- or current trend is up
  }
  else
  {
    if (curTrend == "D")
    {
      curTrend = "U";
      curPivBarIdx = curBar - aHHVBars[curBar];
      aHPivs[curPivBarIdx] = 1;
      aHPivHighs[nHPivs] = H[curPivBarIdx];
      aHPivIdxs[nHPivs] = curPivBarIdx;
      nHPivs++;
    }
    // -- If curTrend is up...else...
  }
  // -- loop through bars
}
// -- Basic attempt to add a pivot this logic may have missed
// -- OK, now I want to look at last two pivots. If the most
// recent low pivot is after the last high, I could
// still have a high pivot that I didn't catch
// -- Start at last bar
curBar = (BarCount - 1);
candIdx = 0;
candPrc = 0;
lastLPIdx = aLPivIdxs[0];
lastLPL = aLPivLows[0];
lastHPIdx = aHPivIdxs[0];
lastHPH = aHPivHighs[0];
if (lastLPIdx > lastHPIdx)
{
  // -- Bar and price info for candidate pivot
  candIdx = curBar - aHHVBars[curBar];
  candPrc = aHHV[curBar];
  if (
  lastHPH < candPrc AND
  candIdx > lastLPIdx AND
  candIdx < curBar)
  {
    // -- OK, we'll add this as a pivot...
    aHPivs[candIdx] = 1;
    // ...and then rearrange elements in the
    // pivot information arrays
    for (j = 0; j < nHPivs; j++)
    {
      aHPivHighs[nHPivs - j] = aHPivHighs[nHPivs -
      (j + 1)];
      aHPivIdxs[nHPivs - j] = aHPivIdxs[nHPivs - (j + 1)];
    }
    aHPivHighs[0] = candPrc;
    aHPivIdxs[0] = candIdx;
    nHPivs++;
  }
}

else
{
  // -- Bar and price info for candidate pivot
  candIdx = curBar - aLLVBars[curBar];
  candPrc = aLLV[curBar];
  if (
  lastLPL > candPrc AND
  candIdx > lastHPIdx AND
  candIdx < curBar)
  {
    // -- OK, we'll add this as a pivot...
    aLPivs[candIdx] = 1;
    // ...and then rearrange elements in the
    // pivot information arrays
    for (j = 0; j < nLPivs; j++)
    {
      aLPivLows[nLPivs - j] = aLPivLows[nLPivs - (j + 1)];
      aLPivIdxs[nLPivs - j] = aLPivIdxs[nLPivs - (j + 1)];
    }
    aLPivLows[0] = candPrc;
    aLPivIdxs[0] = candIdx;
    nLPivs++;
  }
}
// -- Dump inventory of high pivots for debugging
/*
for (k=0; k<nHPivs; k++) {
_TRACE("High pivot no. " + k
+ " at barindex: " + aHPivIdxs[k] + ", "
+ WriteVal(ValueWhen(BarIndex()==aHPivIdxs[k],
DateTime(), 1), formatDateTime)
+ ", " + aHPivHighs[k]);
}
 */
// -- OK, let's plot the pivots using arrows
PlotShapes(IIf(aHPivs == 1, shapeDownArrow, shapeNone), colorRed, 0, High, Offset =  - 15);
PlotShapes(IIf(aLPivs == 1, shapeUpArrow, shapeNone), colorBrightGreen, 0, Low, Offset =  - 15);
_SECTION_END();
7 comments
Leave Comment
Please login here to leave a comment.
Thanks for the afl. I wanted to know does the indicator looks into the future.
hi
it looks better than killer MACD. BUT explorations and scan ismissing. can some one add this?
ravi
qatar
The indicator looks into the future..be careful
Buy Sell signals are dynamic, so trader carefully.
This indicator is of no use to anybody. Because the signals looks into the future. Buy and Sell arrows appear and disappear once the highs and lows are crossed. Just i wasted my precious time going through this.
This is the exactly the same as:
http://www.wisestocktrader.com/indicators/387-heikin-ashi-koma-ashi-with-moving-average-type
with: _SECTION_END(); on Line 204
Useless. The chart is forward looking and repainting.