Alternative ZIG function for Amibroker (AFL)
empottasch over 13 years ago Amibroker (AFL)
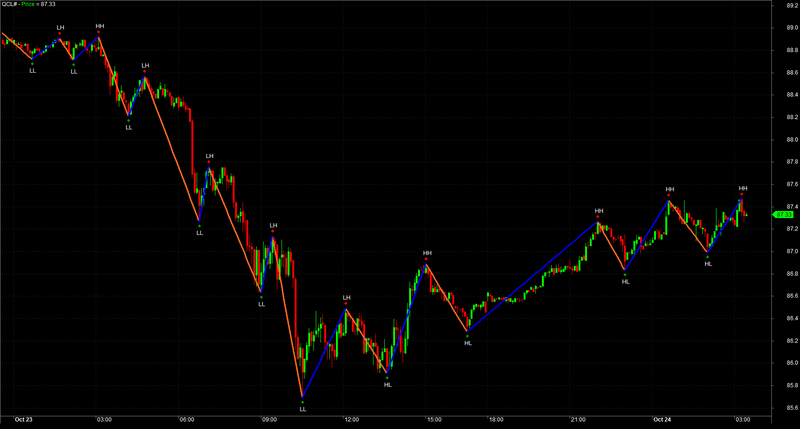
code uses the ATR function and the VSTOP function to calculate a ZIG type function. Using the parameter window you can display the ZIG function and the VSTOP function as well as the pivot points.
Screenshots
Indicator / Formula
Copy & Paste Friendly
// Amibroker AFL code, E.M.Pottasch, Oct 2012
// Alternative Zig type function based on ATR and the VSTOP function
function vstop_func(trBull,trBear)
{
	trailArray[0]=C[0];
	for(i=1;i<BarCount;i++)
	{
		prev=trailArray[i-1];

		if(C[i]>prev AND C[i-1]>prev)
		{
			trailArray[i]=Max(prev,C[i]-trBull[i]);
		}
		else if(C[i]<prev AND C[i-1]< prev)
		{
			trailArray[i]=Min(prev,C[i]+trBear[i]);
		}
		else if (C[i]>prev)
		{
			trailArray[i]=C[i]-trBull[i];
		}
		else
		{
			trailArray[i]=C[i]+trBear[i];
		}
	}
	return trailArray;
}
x=xx=BarIndex();
tc=ParamList("Display Mode","ZIG|VSTOP|ZIG&VSTOP",0);
disp=ParamToggle("Display labels","Off|On",1);
perBull=Param("perBull",20,1,150,1);
perBear=Param("perBear",20,1,150,1);
multBull=Param("multBull",2,1,4,0.05);
multBear=Param("multBear",2,1,4,0.05);

trBull=multBull*ATR(perBull);
trBear=multBear*ATR(perBear);
trailArray = vstop_func(trBull,trBear);
ts=IIf(trailArray>C,trailArray,Null);
tl=IIf(trailArray<C,trailArray,Null);

lll=LLV(L,BarsSince(!IsEmpty(tl)));lll=IIf(ts,lll,Null);llls=lll;
ttt1=IIf((!IsEmpty(ts) AND IsEmpty(Ref(ts,1))) OR BarIndex()==BarCount-1,1,Null);
ttt=ValueWhen(ttt1,lll,0);ttt=IIf(ts,ttt,Null);ttt=IIf(ttt1,Ref(ttt,-1),ttt);
tr=L==ttt;lll=Sum(tr,BarsSince(!IsEmpty(tl)));
qqq=ValueWhen(ttt1,lll,0);qqq=IIf(ts,qqq,Null);qqq=IIf(ttt1,Ref(qqq,-1),qqq);tr=tr AND lll==qqq;
tr=IIf((!IsEmpty(ts) AND IsEmpty(Ref(ts,1)) AND IsEmpty(Ref(ts,-1))),1,tr);//exception
hhh=HHV(H,BarsSince(!IsEmpty(ts)));hhh=IIf(tl,hhh,Null);hhhs=hhh;
ttt1=IIf((!IsEmpty(tl) AND IsEmpty(Ref(tl,1))) OR BarIndex()==BarCount-1,1,Null);
ttt=ValueWhen(ttt1,hhh,0);ttt=IIf(tl,ttt,Null);ttt=IIf(ttt1,Ref(ttt,-1),ttt);
pk=H==ttt;hhh=Sum(pk,BarsSince(!IsEmpty(ts)));
sss=ValueWhen(ttt1,hhh,0);sss=IIf(tl,sss,Null);sss=IIf(ttt1,Ref(sss,-1),sss);pk=pk AND hhh==sss;
pk=IIf((!IsEmpty(tl) AND IsEmpty(Ref(tl,1)) AND IsEmpty(Ref(tl,-1))),1,pk);//exception

px0=ValueWhen(pk,x,0); tx0=ValueWhen(tr,x,0);
px1=ValueWhen(pk,x,1); tx1=ValueWhen(tr,x,1);
px2=ValueWhen(pk,x,2); tx2=ValueWhen(tr,x,2);
ph0=ValueWhen(pk,H,0); tl0=ValueWhen(tr,L,0);
ph1=ValueWhen(pk,H,1); tl1=ValueWhen(tr,L,1);
ph2=ValueWhen(pk,H,2); tl2=ValueWhen(tr,L,2);

switch(tc)
{
case("ZIG"):
aa1=IIf(px0>tx1,(ph0-tl1)/(px0-tx1),0);aa1=IIf(pk,Ref(aa1,-1),aa1);ls1=aa1*(xx-tx1)+tl1;
bb1=IIf(px0>tx1 AND px1<tx1,1,0);bb1=bb1+Ref(bb1,-1);bb1=IIf(bb1,1,0);ls1=IIf(bb1,ls1,Null);
Plot(ls1,"",colorBlue,styleLine,0,0,0,2,3);
aa1=IIf(tx0>px1,(tl0-ph1)/(tx0-px1),0);aa1=IIf(tr,Ref(aa1,-1),aa1);ls1=aa1*(xx-px1)+ph1;
bb1=IIf(tx0>px1 AND tx1<px1,1,0);bb1=bb1+Ref(bb1,-1);bb1=IIf(bb1,1,0);ls1=IIf(bb1,ls1,Null);
Plot(ls1,"",colorOrange,styleLine,0,0,0,2,3);
break;
case("VSTOP"):
Plot(ts,"\ntrailShort",colorRed,styleLine,0,0,0,1,1);
Plot(llls,"",colorRed,styleDashed,0,0,0,1,1);
Plot(tl,"\ntrailLong",colorGreen,styleLine,0,0,0,1,1);
Plot(hhhs,"",colorGreen,styleDashed,0,0,0,1,1);
break;
case("ZIG&VSTOP"):
aa1=IIf(px0>tx1,(ph0-tl1)/(px0-tx1),0);aa1=IIf(pk,Ref(aa1,-1),aa1);ls1=aa1*(xx-tx1)+tl1;
bb1=IIf(px0>tx1 AND px1<tx1,1,0);bb1=bb1+Ref(bb1,-1);bb1=IIf(bb1,1,0);ls1=IIf(bb1,ls1,Null);
Plot(ls1,"",colorBlue,styleLine,0,0,0,2,3);
aa1=IIf(tx0>px1,(tl0-ph1)/(tx0-px1),0);aa1=IIf(tr,Ref(aa1,-1),aa1);ls1=aa1*(xx-px1)+ph1;
bb1=IIf(tx0>px1 AND tx1<px1,1,0);bb1=bb1+Ref(bb1,-1);bb1=IIf(bb1,1,0);ls1=IIf(bb1,ls1,Null);
Plot(ls1,"",colorOrange,styleLine,0,0,0,2,3);
Plot(ts,"\ntrailShort",colorRed,styleLine,0,0,0,1,1);
Plot(llls,"",colorRed,styleDashed,0,0,0,1,1);
Plot(tl,"\ntrailLong",colorGreen,styleLine,0,0,0,1,1);
Plot(hhhs,"",colorGreen,styleDashed,0,0,0,1,1);
break;
}

GraphXSpace = 5;
SetChartOptions(0, chartShowDates);
SetBarFillColor(IIf(C>O,ParamColor("Candle Up Color", colorBrightGreen),IIf(C<=O,ParamColor("Candle Down Color", colorRed),colorLightGrey)));
//Plot(C,"Price",IIf(!IsEmpty(tl),ParamColor("Shadow Uptrend Color", ColorRGB(0,120,0)),IIf(!IsEmpty(ts),ParamColor("Shadow Downtrend Color", ColorRGB(120,0,0)),colorLightGrey)),64,0,0,0,0,1);
Plot(C,"Price",IIf(C>O,ParamColor("Shadow Up Color", ColorRGB(0,255,0)),IIf(C<=O,ParamColor("Shadow Color", ColorRGB(255,0,0)),colorLightGrey)),64,0,0,0,0,1);

PlotShapes(shapeSmallCircle*tr,colorGreen,0,L,-10);
PlotShapes(shapeSmallCircle*pk,colorRed,0,H,10);

dxhm=14;dxlm=10;dxh=0;dxl=0;dyhm=5;dylm=3;dyh=18;dyl=29;hm=30;lm=30;
function GetVisibleBarCount()
{
	lvb=Status("lastvisiblebar");
	fvb=Status("firstvisiblebar");
	return Min(lvb-fvb,BarCount-fvb);
}
function GfxConvertPixelsToBarX(Pixels)
{
	lvb=Status("lastvisiblebar");
	fvb=Status("firstvisiblebar");
	pxchartleft=Status("pxchartleft");
	pxchartwidth=Status("pxchartwidth");
	fac=pxchartwidth/Pixels;
	bar=(lvb-fvb)/fac;
	return bar;
}
function GfxConvertPixelToValueY(Pixels)
{
	local Miny,Maxy,pxchartbottom,pxchartheight;
	Miny=Status("axisminy");
	Maxy=Status("axismaxy");
	pxchartbottom=Status("pxchartbottom");
	pxchartheight=Status("pxchartheight");
	fac=pxchartheight/Pixels;
	Value=(Maxy-Miny)/fac;
	return Value;
}
if(disp)
{
ll=tr AND tl1<tl2;
hl=tr AND tl1>tl2;
hh=pk AND ph1>ph2;
lh=pk AND ph1<ph2;
dt=pk AND ph1==ph2;
db=tr AND tl1==tl2;

miny=Status("axisminy");
maxy=Status("axismaxy");
AllVisibleBars=GetVisibleBarCount();
fvb=Status("firstvisiblebar");
LowMargin=Miny+GfxConvertPixelToValueY(lm);
HighMargin=Maxy-GfxConvertPixelToValueY(hm);
dyllm=GfxConvertPixelToValueY(dylm);
dyhhm=GfxConvertPixelToValueY(dyhm);
dyll=GfxConvertPixelToValueY(dyl);
dyhh=GfxConvertPixelToValueY(dyh);
dxllm=GfxConvertPixelsToBarX(dxlm);
dxhhm=GfxConvertPixelsToBarX(dxhm);
dxll=GfxConvertPixelsToBarX(dxl);
dxhh=GfxConvertPixelsToBarX(dxh);

for(i=0;i<AllVisibleBars;i++)
{
	if(ll[i+fvb] AND L[i+fvb]>LowMargin) PlotText("LL",i+fvb+dxll,L[i+fvb]-dyll,colorWhite,colorBlack);
	if(ll[i+fvb] AND L[i+fvb]<=LowMargin) PlotText("LL",i+fvb+dxll+dxllm,L[i+fvb]-dyllm,colorWhite,colorBlack);
	if(hl[i+fvb] AND L[i+fvb]>LowMargin) PlotText("HL",i+fvb+dxll,L[i+fvb]-dyll,colorWhite,colorBlack);
	if(hl[i+fvb] AND L[i+fvb]<=LowMargin) PlotText("HL",i+fvb+dxll+dxllm,L[i+fvb]-dyllm,colorWhite,colorBlack);
	if(db[i+fvb] AND L[i+fvb]>LowMargin) PlotText("DB",i+fvb+dxll,L[i+fvb]-dyll,colorWhite,colorBlack);
	if(db[i+fvb] AND L[i+fvb]<=LowMargin) PlotText("DB",i+fvb+dxll+dxllm,L[i+fvb]-dyllm,colorWhite,colorBlack);
	if(hh[i+fvb] AND H[i+fvb]<HighMargin) PlotText("HH",i+fvb+dxhh,H[i+fvb]+dyhh,colorWhite,colorBlack);
	if(hh[i+fvb] AND H[i+fvb]>=HighMargin) PlotText("HH",i+fvb+dxhh+dxhhm,H[i+fvb]+dyhhm,colorWhite,colorBlack);
	if(lh[i+fvb] AND H[i+fvb]<HighMargin) PlotText("LH",i+fvb+dxhh,H[i+fvb]+dyhh,colorWhite,colorBlack);
	if(lh[i+fvb] AND H[i+fvb]>=HighMargin) PlotText("LH",i+fvb+dxhh+dxhhm,H[i+fvb]+dyhhm,colorWhite,colorBlack);
	if(dt[i+fvb] AND H[i+fvb]<HighMargin) PlotText("DT",i+fvb+dxhh,H[i+fvb]+dyhh,colorWhite,colorBlack);
	if(dt[i+fvb] AND H[i+fvb]>=HighMargin) PlotText("DT",i+fvb+dxhh+dxhhm,H[i+fvb]+dyhhm,colorWhite,colorBlack);
}
}
14 comments
Leave Comment
Please login here to leave a comment.
2 error found in above formula.
Admin kindly fix them.
Thanx you
All fine here anandnst
Admin it is giving errors in Amibroker ver 5.50. Line no 82 and 85 … pls check n fix them
I cant post the preview(Pic), else i would
Thnx you in advance.
Hi
Errors reported in the following lines,“Too Many Arguments”
Plot(ls1,"",colorBlue,styleLine,0,0,0,2,3);
Plot(ls1,"",colorOrange,styleLine,0,0,0,2,3);
Plot(C,“Price”,IIf(C>O,ParamColor(“Shadow Up Color”, ColorRGB(0,255,0)),IIf(C<=O,ParamColor(“Shadow Color”, ColorRGB(255,0,0)),colorLightGrey)),64,0,0,0,0,1);
Please help us to sort it out
Thanks
Sudha
I am not a coder,so seeking apology in advance if I m wrong,I fixed it through below simple process..and working nicely
Replace error showing 3 lines with modified lines as quoted below..
Pls inform whether works in your Ami too..
Plot(ls1,"",colorBlue,styleLine,0,0,2,3);
Plot(ls1,"",colorOrange,styleLine,0,0,2,3);
Plot(C,“Price”,IIf(C>O,ParamColor(“Shadow Up Color”, ColorRGB(0,255,0)),IIf(C<=O,ParamColor(“Shadow Color”, ColorRGB(255,0,0)),colorLightGrey)),64,0,0,0,1);
the errors you find are all due to the fact that you are using an old version of Amibroker. You can just adjust the number of parameters in the Plot statement and it will work. An extra parameter was added in version 5.52. release statement:
Charts: Plot/PlotForeign/PlotOHLC now adds extra parameter “width” that controls the width of the line. Positive values specify PIXEL width, negative values specify width in percent of current bar width. So for example -20 will give you dynamic width that is 20% of bar width. Example:
Plot( C, “Close”, colorBlack, styleBar, Null, Null, 0, 1, -20 /* line width as percent of bar */ );
Hi,
shariful and empottasch, its working right now. Thanks for your kind help
Sudha
THANKS i am really thankful to all contributors and to this website. i have also contributed some nice afls but i dont know why admin is not publishing them
for those who r still getting error:
In Amibroker 5.6
Plot( array, name, color/barcolor, style = styleLine, minvalue = {empty}, maxvalue = {empty}, XShift = 0, Zorder = 0, width = 1 )
so please delete the last digit and last comma and the code will be done.
e.g.Line 82:
Plot(ls1,"",colorBlue,styleLine,0,0,0,2,3);
replace it by :
Plot(ls1,"",colorBlue,styleLine,0,0,0,2);
likewise do it for all PLOT lines.
Thanx…!
for removing error simply remove 0ne of zero from plot function in errored lines
Yes after removing One of the zero from every error line.. It is working fine now.
Thnx you
Monster Ed!
Thank you, good contribution
Master work, Pottasch!
Thanks