Alternative ZIG type function for Amibroker (AFL)
empottasch over 13 years ago Amibroker (AFL)
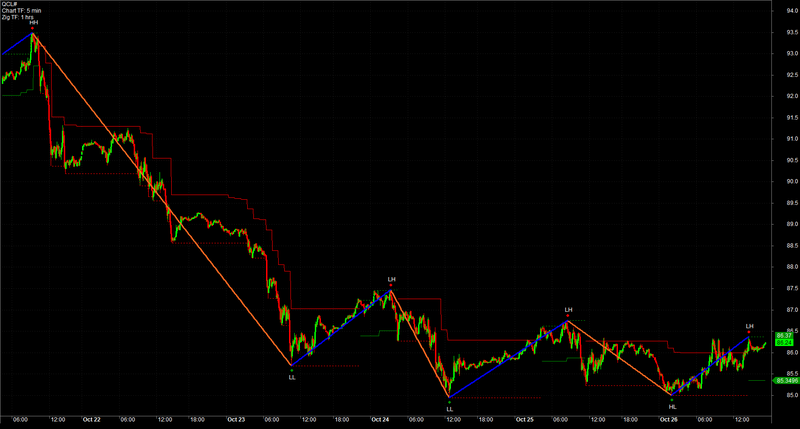
Alternative ZIG type function which is based on the ATR and VSTOP functions. In this code I added multiple timeframes. So you can set your chart for instance in the 5 minute timeframe and calculate the ZIG type function in the 1 hour timeframe. You can use the parameter window to set the timeframe of the ZIG type function and chose between ZIG display or VSTOP display. If it is usefull or not is up to you. I am just working a bit on my skills.
The chart I add shows for instance the data in the 5 minute timeframe while the ZIG function is calculated in the 1 hour timeframe.
Screenshots
Indicator / Formula
Copy & Paste Friendly
// Amibroker AFL code by Edward Pottasch, Oct 2012
// alternative ZIG type function based on the ATR and VSTOP functions
// added multiple timeframes. Maximum timeframe set to 1440 minutes
x=xx=BarIndex();
tc=ParamList("Display Mode","ZIG|VSTOP|ZIG&VSTOP",0);
disp=ParamToggle("Display labels","Off|On",1);
tf=Param("Time Frame (min)",5,1,1440,1);tfrm=in1Minute*tf;
perBull=Param("perBull",20,1,150,1);
perBear=Param("perBear",20,1,150,1);
multBull=Param("multBull",2,0.05,4,0.05);
multBear=Param("multBear",2,0.05,4,0.05);

TimeFrameSet(tfrm);
function vstop_func(trBull,trBear)
{
	trailArray[0]=C[0];
	for(i=1;i<BarCount;i++)
	{
		prev=trailArray[i-1];

		if(C[i]>prev AND C[i-1]>prev)
		{
			trailArray[i]=Max(prev,C[i]-trBull[i]);
		}
		else if(C[i]<prev AND C[i-1]< prev)
		{
			trailArray[i]=Min(prev,C[i]+trBear[i]);
		}
		else if (C[i]>prev)
		{
			trailArray[i]=C[i]-trBull[i];
		}
		else
		{
			trailArray[i]=C[i]+trBear[i];
		}
	}
	return trailArray;
}

trBull=multBull*ATR(perBull);
trBear=multBear*ATR(perBear);
trailArray = vstop_func(trBull,trBear);
ts=IIf(trailArray>C,trailArray,Null);
tl=IIf(trailArray<C,trailArray,Null);
TimeFrameRestore();

ts=TimeFrameExpand(ts,tfrm,expandLast);
tl=TimeFrameExpand(tl,tfrm,expandLast);

GraphXSpace=5;
SetChartOptions(0, chartShowDates);
SetBarFillColor(IIf(C>O,ParamColor("Candle Up Color", colorBrightGreen),IIf(C<=O,ParamColor("Candle Down Color", colorRed),colorLightGrey)));
Plot(C,"Price",IIf(C>O,ParamColor("Shadow Up Color", colorBrightGreen),IIf(C<=O,ParamColor("Shadow Color", colorRed),colorLightGrey)),64,0,0,0,0,1);

lll=LLV(L,BarsSince(!IsEmpty(tl)));lll=IIf(ts,lll,Null);llls=lll;
ttt1=IIf((!IsEmpty(ts) AND IsEmpty(Ref(ts,1))) OR BarIndex()==BarCount-1,1,Null);
ttt=ValueWhen(ttt1,lll,0);ttt=IIf(ts,ttt,Null);ttt=IIf(ttt1,Ref(ttt,-1),ttt);
tr=L==ttt;lll=Sum(tr,BarsSince(!IsEmpty(tl)));
qqq=ValueWhen(ttt1,lll,0);qqq=IIf(ts,qqq,Null);qqq=IIf(ttt1,Ref(qqq,-1),qqq);tr=tr AND lll==qqq;
tr=IIf((!IsEmpty(ts) AND IsEmpty(Ref(ts,1)) AND IsEmpty(Ref(ts,-1))),1,tr);//exception
hhh=HHV(H,BarsSince(!IsEmpty(ts)));hhh=IIf(tl,hhh,Null);hhhs=hhh;
ttt1=IIf((!IsEmpty(tl) AND IsEmpty(Ref(tl,1))) OR BarIndex()==BarCount-1,1,Null);
ttt=ValueWhen(ttt1,hhh,0);ttt=IIf(tl,ttt,Null);ttt=IIf(ttt1,Ref(ttt,-1),ttt);
pk=H==ttt;hhh=Sum(pk,BarsSince(!IsEmpty(ts)));
sss=ValueWhen(ttt1,hhh,0);sss=IIf(tl,sss,Null);sss=IIf(ttt1,Ref(sss,-1),sss);pk=pk AND hhh==sss;
pk=IIf((!IsEmpty(tl) AND IsEmpty(Ref(tl,1)) AND IsEmpty(Ref(tl,-1))),1,pk);//exception

px0=ValueWhen(pk,x,0); tx0=ValueWhen(tr,x,0);
px1=ValueWhen(pk,x,1); tx1=ValueWhen(tr,x,1);
px2=ValueWhen(pk,x,2); tx2=ValueWhen(tr,x,2);
ph0=ValueWhen(pk,H,0); tl0=ValueWhen(tr,L,0);
ph1=ValueWhen(pk,H,1); tl1=ValueWhen(tr,L,1);
ph2=ValueWhen(pk,H,2); tl2=ValueWhen(tr,L,2);

switch(tc)
{
case("ZIG"):
aa1=IIf(px0>tx1,(ph0-tl1)/(px0-tx1),0);aa1=IIf(pk,Ref(aa1,-1),aa1);ls1=aa1*(xx-tx1)+tl1;
bb1=IIf(px0>tx1 AND px1<tx1,1,0);bb1=bb1+Ref(bb1,-1);bb1=IIf(bb1,1,0);ls1=IIf(bb1,ls1,Null);
Plot(ls1,"",colorBlue,styleLine,0,0,0,2,3);
aa1=IIf(tx0>px1,(tl0-ph1)/(tx0-px1),0);aa1=IIf(tr,Ref(aa1,-1),aa1);ls1=aa1*(xx-px1)+ph1;
bb1=IIf(tx0>px1 AND tx1<px1,1,0);bb1=bb1+Ref(bb1,-1);bb1=IIf(bb1,1,0);ls1=IIf(bb1,ls1,Null);
Plot(ls1,"",colorOrange,styleLine,0,0,0,2,3);
break;
case("VSTOP"):
Plot(ts,"\ntrailShort",colorRed,styleLine,0,0,0,1,1);
Plot(llls,"",colorRed,styleDashed,0,0,0,1,1);
Plot(tl,"\ntrailLong",colorGreen,styleLine,0,0,0,1,1);
Plot(hhhs,"",colorGreen,styleDashed,0,0,0,1,1);
break;
case("ZIG&VSTOP"):
aa1=IIf(px0>tx1,(ph0-tl1)/(px0-tx1),0);aa1=IIf(pk,Ref(aa1,-1),aa1);ls1=aa1*(xx-tx1)+tl1;
bb1=IIf(px0>tx1 AND px1<tx1,1,0);bb1=bb1+Ref(bb1,-1);bb1=IIf(bb1,1,0);ls1=IIf(bb1,ls1,Null);
Plot(ls1,"",colorBlue,styleLine,0,0,0,2,3);
aa1=IIf(tx0>px1,(tl0-ph1)/(tx0-px1),0);aa1=IIf(tr,Ref(aa1,-1),aa1);ls1=aa1*(xx-px1)+ph1;
bb1=IIf(tx0>px1 AND tx1<px1,1,0);bb1=bb1+Ref(bb1,-1);bb1=IIf(bb1,1,0);ls1=IIf(bb1,ls1,Null);
Plot(ls1,"",colorOrange,styleLine,0,0,0,2,3);
Plot(ts,"\ntrailShort",colorRed,styleLine,0,0,0,1,1);
Plot(llls,"",colorRed,styleDashed,0,0,0,1,1);
Plot(tl,"\ntrailLong",colorGreen,styleLine,0,0,0,1,1);
Plot(hhhs,"",colorGreen,styleDashed,0,0,0,1,1);
break;
}

PlotShapes(shapeSmallCircle*tr,colorGreen,0,L,-10);
PlotShapes(shapeSmallCircle*pk,colorRed,0,H,10);

qq=Interval()/60;
if(qq < 60){tf=" min";tt=qq;}
else if(qq >= 60 AND qq < 1440){tf=" hrs";tt=qq/60;}
else if(qq >= 1440){tf=" days";tt=(qq/60)/24;}
qq=Max(tfrm/60,Interval()/60);
if(qq < 60){tfa=" min";tta=qq;}
else if(qq >= 60 AND qq < 1440){tfa=" hrs";tta=qq/60;}
else if(qq >= 1440){tfa=" days";tta=(qq/60)/24;}

Title = Name() +
"\nChart TF: " + tt + tf +
"\nZig TF: " + tta + tfa;

dxhm=14;dxlm=10;dxh=0;dxl=0;dyhm=5;dylm=3;dyh=18;dyl=29;hm=30;lm=30;
function GetVisibleBarCount()
{
	lvb=Status("lastvisiblebar");
	fvb=Status("firstvisiblebar");
	return Min(lvb-fvb,BarCount-fvb);
}
function GfxConvertPixelsToBarX(Pixels)
{
	lvb=Status("lastvisiblebar");
	fvb=Status("firstvisiblebar");
	pxchartleft=Status("pxchartleft");
	pxchartwidth=Status("pxchartwidth");
	fac=pxchartwidth/Pixels;
	bar=(lvb-fvb)/fac;
	return bar;
}
function GfxConvertPixelToValueY(Pixels)
{
	local Miny,Maxy,pxchartbottom,pxchartheight;
	Miny=Status("axisminy");
	Maxy=Status("axismaxy");
	pxchartbottom=Status("pxchartbottom");
	pxchartheight=Status("pxchartheight");
	fac=pxchartheight/Pixels;
	Value=(Maxy-Miny)/fac;
	return Value;
}
if(disp)
{
ll=tr AND tl1<tl2;
hl=tr AND tl1>tl2;
hh=pk AND ph1>ph2;
lh=pk AND ph1<ph2;
dt=pk AND ph1==ph2;
db=tr AND tl1==tl2;

miny=Status("axisminy");
maxy=Status("axismaxy");
AllVisibleBars=GetVisibleBarCount();
fvb=Status("firstvisiblebar");
LowMargin=Miny+GfxConvertPixelToValueY(lm);
HighMargin=Maxy-GfxConvertPixelToValueY(hm);
dyllm=GfxConvertPixelToValueY(dylm);
dyhhm=GfxConvertPixelToValueY(dyhm);
dyll=GfxConvertPixelToValueY(dyl);
dyhh=GfxConvertPixelToValueY(dyh);
dxllm=GfxConvertPixelsToBarX(dxlm);
dxhhm=GfxConvertPixelsToBarX(dxhm);
dxll=GfxConvertPixelsToBarX(dxl);
dxhh=GfxConvertPixelsToBarX(dxh);

for(i=0;i<AllVisibleBars;i++)
{
	if(ll[i+fvb] AND L[i+fvb]>LowMargin) PlotText("LL",i+fvb+dxll,L[i+fvb]-dyll,colorWhite,colorBlack);
	if(ll[i+fvb] AND L[i+fvb]<=LowMargin) PlotText("LL",i+fvb+dxll+dxllm,L[i+fvb]-dyllm,colorWhite,colorBlack);
	if(hl[i+fvb] AND L[i+fvb]>LowMargin) PlotText("HL",i+fvb+dxll,L[i+fvb]-dyll,colorWhite,colorBlack);
	if(hl[i+fvb] AND L[i+fvb]<=LowMargin) PlotText("HL",i+fvb+dxll+dxllm,L[i+fvb]-dyllm,colorWhite,colorBlack);
	if(db[i+fvb] AND L[i+fvb]>LowMargin) PlotText("DB",i+fvb+dxll,L[i+fvb]-dyll,colorWhite,colorBlack);
	if(db[i+fvb] AND L[i+fvb]<=LowMargin) PlotText("DB",i+fvb+dxll+dxllm,L[i+fvb]-dyllm,colorWhite,colorBlack);
	if(hh[i+fvb] AND H[i+fvb]<HighMargin) PlotText("HH",i+fvb+dxhh,H[i+fvb]+dyhh,colorWhite,colorBlack);
	if(hh[i+fvb] AND H[i+fvb]>=HighMargin) PlotText("HH",i+fvb+dxhh+dxhhm,H[i+fvb]+dyhhm,colorWhite,colorBlack);
	if(lh[i+fvb] AND H[i+fvb]<HighMargin) PlotText("LH",i+fvb+dxhh,H[i+fvb]+dyhh,colorWhite,colorBlack);
	if(lh[i+fvb] AND H[i+fvb]>=HighMargin) PlotText("LH",i+fvb+dxhh+dxhhm,H[i+fvb]+dyhhm,colorWhite,colorBlack);
	if(dt[i+fvb] AND H[i+fvb]<HighMargin) PlotText("DT",i+fvb+dxhh,H[i+fvb]+dyhh,colorWhite,colorBlack);
	if(dt[i+fvb] AND H[i+fvb]>=HighMargin) PlotText("DT",i+fvb+dxhh+dxhhm,H[i+fvb]+dyhhm,colorWhite,colorBlack);
}
}
42 comments
Leave Comment
Please login here to leave a comment.
Dear sir, thx for ur contribution,
the line: 54 – 81 – 84 are says error message. pls try to solve or give some explanation for how to install ( am using AMI 5.20
THX..
the errors you find are all due to the fact that you are using an older version of Amibroker. You can just adjust the number of parameters in the Plot statement and it will work. An extra parameter was added in version 5.52. Below the release statement from Amibroker v5.52:
Charts: Plot/PlotForeign/PlotOHLC now adds extra parameter “width” that controls the width of the line. Positive values specify PIXEL width, negative values specify width in percent of current bar width. So for example -20 will give you dynamic width that is 20% of bar width. Example:
Plot( C, “Close”, colorBlack, styleBar, Null, Null, 0, 1, -20 /* line width as percent of bar */ );
Hello empottasch,
thnx you for doing modifications in ur old one.
Well i m using Ami 5.50 version n finding errors n i have deleted one zero from every error. But i got ur older version only
(Alternative Zig function).
Not able to get the modified one with ATR N VSTOP.
Regards
hi,
after v5.5 just one additional parameter was added to the Plot function. So if you find in the code for instance:
Plot(hhhs,"",colorGreen,styleDashed,0,0,0,1,1);
you just remove the last parameter and you will get:
Plot(hhhs,"",colorGreen,styleDashed,0,0,0,1);
that should work with v5.5
regards, Ed
Hello Ed,
Removed the last parameter but no change found.
Regards
not sure. I just copied the code as presented here on Wisestocktrader and it runs without problems in Amibroker version 5.60.2
I am not sure what the error is you are getting.
Hellow empottasch,
Vert good afl.
Is this possible to print values text at HH,LL,LH….. For example the code is given below.
Hellow empottasch,
there was problem in pasting the code.
Herewith adding the same
Is this possible to print values text at HH,LL,LH….. For example the code is given below.
Hellow Anandst,
I have modified this code for version 5.52. Created as new indicator as i can not post here ( which more than 3000 words). After approval, you can checkit.
Bye the way, Is it possible to stamp values ( HH, LL….) on the chart? Also I requested the same to Mr.empottasch
Thanks
Viswanath
hi,
yes. I could not paste all the code (too long and errors occur when I copy and paste)
I can Email it to you if you leave an email address
Ed
Thanks Ed, Please email the AFL to kv_maligi@yahoo.com
Viswanath
Hellow Ed,
I think this AFL has pretty good logic in swing trading
Is there any exploration to find breakout of HH or LL …. I mean how to find buy/sell
Kindly provide some clue regarding this.
Thanks
viswanath
hi,
actually the intention was just to post the code as an alternative ZIGZAG function. I tried it out and it works pretty good.
But indeed there are several ways you could use it. 1) you can ride the VSTOP trend but that works only for very volatile futures. 2) you can use the pivot levels as support/resistance or breakout levels. 3) you can use the pivots to construct these harmonic patterns like ABCD, Crab etc.
In the version I sent to you by Email I also added support and resistance levels (see parameter window). The trick is to make good rules at support and resistance. This is the way these machines trade these days. When the price reaches for instance resistance you could short but then you need clear rules when this short should be reversed to a long and where you put your target.
if you have some good rules I will be happy to try it out.
@empottasch
In the future you can put the code in the indicator pasties section and post a link if it’s too long. That’s what that section was made for.
ok thanks. I wasn’t aware of that.
Is it possible to add chart examples inside a comment? I have seen people do that but I do not see tools that enable image editing inside a comment. Thanks
Yes upload the image to http://imageshack.us/ then use the built in editor (button with painting) on this site to link to the DIRECT image link.
Hellow Ed,
I did not get the mail, Please check from yourside whether it is bounced/wrong email id.
Please forward it to kv_maligi@yahoo.com
Basically I find your AFL very useful. I use it in the following manner
1) I use ichimoku chart
2) For buy signal ( of Tenken/kiyunsen cross) or kumo breakout, i check following for going long
a) whether chickuspan is above price curve & also above kumo.
If not, i will wait it to happen
At this conditions, i check whether swing is broken? what type of swing it is broken? whether it is HH or LH
Same rules applied for sell/shorting
If you need the AFL code for the above ichimoku, Please let me know. I will forward the same
Thanks
viswanath
@administrator, thanks for your reply. However, when I want to place a comment all I see is a space/area where I can put text and a submit button. I do not see this button with painting. Could you explain how I get to that editor?
@kv_maligi, I will try to post this code in the indicator pasties section.
put it in the pasties section: http://wisestocktrader.com/indicatorpasties/352-alternative-zig-type-function-some-additions
Many many thanks Mr.Ed. I have taken the code from link, its superb.
Hellow Ed,
The ichimoku logic which i use is having its own advantages & also disadvantages
advantages:
1) you can figure out strong or weak buy
2) i have exploration for buy/sell signals
3) It works well for higher TFs day & week
disadvatages
1) tedious one, need wait for signal to cross CS line above price & above kumo
2) Risk reward ratio is high
I think your idea is great. ie Trying to trade around at resistance/support levels. In this approach, risk is very less, reward is great.
But do you have exploration/scanning to pull the list of stocks for this.
I request you please develop exploration to pull out the list which are reached support/resistance or for whose stocks the stamping of HH,LL…. is done. In this way, we can come to know whether to long or short keeping the SL as pivot.
Once again thanks a lot & God Bless you
Viswanath
Hellow Ed,
Please refer this AFL. I will update one more AFL later.
This AFL is giving buy signal just after support & sell at resistance. But it gives many signals
http://www.wisestocktrader.com/indicators/3314-fibonacci-trading-system.txt
Thanks
Viswanath
hi kv,
wanted to reply with a chart but can’t find the paint button :) I am at the moment looking at Ichimoku (http://www.wisestocktrader.com/indicators/85-brian-wild-ichimoku). Did not test it yet but this type of trading is very tough in my opinion. I have only been able to make S/R type of systems that continue to be succesfull over a longer period. The more computers take over trading the better these type of systems seem to work.
S/R levels however are not always precise. Sometimes they make a false breakout move only to come back and move the other way. So the challenge is to set up a good set of rules. Did not do this yet for this code. I use sortof S/R levels that defined by previous days range at the moment
Hellow Ed,
Please refer this AFL. you may think of developing exploration on this basis.
http://www.wisestocktrader.com/indicatorpasties/109-the-beast-with-auto-buy-signal.txt
If you want ichimoku documnets, i have very good materiel with me. I can send you by mail.
I have AFL for charting & exploration for two strategies ( there are total 5 ichimoku trading strategies)
Let me refresh how to add charts in easy method
Thanks
viswanath
Hellow Ed,
Please update your email id so that i can send some documents
thanks
viswanath
thanks kv,
my Email is empottasch@skynet.be
will look at your documents during the day
Try this for SUPPORT/RESISTANCE
yes thanks, this code is by David Keleher, at least parts of it. I could build Fib retracement lines between the pivots as well. Maybe as an experiment see how prices line up.
I added a version in the Pasties section that adds Fib retracement levels. Let me know if it is any good. Don’t know much about fibs myself,
Use parameter window to activate the levels and you can also set the number of levels to be displayed. Default I set to 7 levels
Ed
Viswanath,
I am receiving your Emails, however not your attachments. Also apparently you are not receiving my reply Emails. Do you have another Email account via your service provider? Seems like yahoo is blocking traffic,
Ed
Hello empottasch,
Really good work i must say (FIB LEVELS BY YOU)
1) SUPPORT LEVELS
2) FIB LEVELS
GR8 GOING.. KEEP IT UP
HELPFUL IN DAILY N WEEKLY TF.
THANX YOU
Anandnst@gmail.com
hello Empottasch,
I need one small help from you.
Would u please provide me Fibo levels code or formula.so i can drag n drop on my other Codes ,it would be really helpful.
Paste the code here in comments section Or else mail me -
Anandnst@gmail.com
Thanx you
thanks. It is just the piece of code at the bottom (enclosed by the if statement disp3). Personally I do not like these fibs very much. Only the 100% level but these are also shown with the S/R indicator. There are so many of these fib levels that one starts to “see” things that are just coincidence. The 100% level is very real, at least for heavily traded futures, stocks and forex. Tomorrow I will post the last version of this pivot stuff where I add some interesting channels which is an idea i got from another Amibroker user.
Also this indicator is actually intended for intraday data. You can also use it for EOD and weekly but you can’t change the timeframe (or you have to change the number 1440 in the code). The idea is that you display for instance 5min data and use a timeframe of 1 or 2 hours to calculate the pivots.
Hellow Ed,
attachments for ichimoku docs & Kwikpop AFL are sent successfully today. Another 2 AFL for ichimoku will follow later
Thanks
Viswanath
i emailed adjuested Kwikpop. Let me know if you can receive it. I could also put it in the pasties section.
reason why I couldn’t show charts is due to my browser. Apparently Chrome and Internet Explorer do not show this toolbox and Firefox does, at least with my current settings
Dear sir, thx for ur contribution, more usefull.
@ Em. Pottasch, hi sir, kindly help me,
how can we write " early Day first opening 5min candle closing ".
pls write afl code for that,
regards
muralikrishna
Mural,
not sure I understand. Please send me an Email with your question at empottasch@skynet.be
similar type of code I posted here:
http://wisestocktrader.com/indicatorpasties/548-pivot-code
maybe this will help,
regards, ed
@ Em. Pottasch, hi sir, excuse me my english, my question is
for Example : below code gives Yesterdays closing price
DayC=TimeFrameGetPrice(“C”,inDaily,-1);
so
wich code gives To days early morning (market opening time) first candle (5 minut or 15 minut candle) closing price value?
like this? regards, Ed
thank u very much sir
Hi,
I’m trying to create the 3 level ZZ for Amibroker. However I’m, stuck with the main process of creating the zigzag function as same as the one in MT4 where it uses three parameters (Depth, Deviation & Backstep). Will be a great help if you could oonvert the mt4 zigzag function to afl.
Thanks In Advance.
This AFL is brilliant. I can do the backtest with this instead of ZIG due to future reference.
Thanks!