SuppRes+Pivot Buy Sell+MA+Trendline for Amibroker (AFL)
sm_friend about 13 years ago Amibroker (AFL)
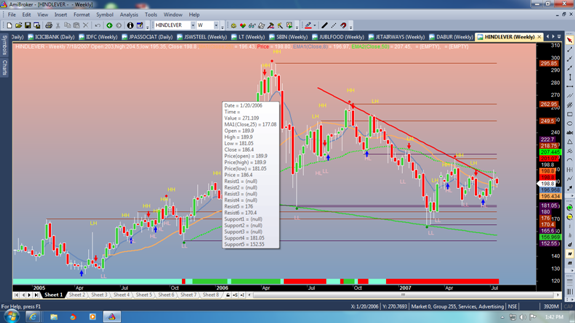
This is a Combination Of Many AFLs’s Basically Good For EOD.
Use 8 EMA , 25 EMA & 50 EMA From Parameters.
Screenshots
Indicator / Formula
Copy & Paste Friendly
_SECTION_BEGIN("KH_PriceChart");
//-- Author : KelvinHand

bgTop = ParamColor("BgTop",    colorBlack);
bgBot = ParamColor("BgBottom", colorBlack);
SetChartBkGradientFill( bgTop ,bgBot, colorLightGrey);

pStyle = ParamList("Price Style", "Candle|Solid Candle|Bar|Line|Heikin-Ashi");
cBull = ParamColor("Price Bull", colorLime);
CBear = ParamColor("Price Bear", colorRed);
cLine = ParamColor("Price Line", colorWhite);


SetChartOptions(0,chartShowArrows|chartShowDates);
_N(Title = StrFormat("{{NAME}}- {{INTERVAL}} {{DATE}} O= %g, H= %g, L= %g, C= %g (%.1f%%) V= " +WriteVal( V, 1.0 ) +"\n{{VALUES}}", O, H, L, C, SelectedValue( ROC( C, 1 )) ));

ThisStyle = styleCandle;
ThisTitle = "";

_O=O; _C=C; _H=H; _L=L;

ThisColor = IIf( _C>_O, cBull, IIf(_C<_O, CBear, CLine));


switch (pStyle )
{

  case "Solid Candle":
        SetBarFillColor( ThisColor );
        break;


  case "Bar":
       ThisStyle = styleBar;
       break;

  case "Line":
      ThisStyle = styleLine;
      ThisColor = cLine;
       break;


  case "Heikin-Ashi":
       _C = (O+H+L+C)/4;
		  _O = AMA( Ref( _C, -1 ), 0.5 );
       _H = Max( H, Max( _C, _O ) );
       _L = Min( L, Min( _C, _O ) );

       ThisColor = IIf(_C >= _O,CBull, CBear);
       SetBarFillColor( ThisColor );

       ThisColor = IIf(_C >= _O,cLine, cLine);
		  ThisTitle = "Heikin-Ashi";
       break;

  default:
        SetBarFillColor( ThisColor );
        ThisColor = cLine;

       break;

}


   PlotOHLC( _O, _H, _L, _C, ThisTitle, ThisColor, ThisStyle);


GraphXSpace = 5;


//This Section is For HH HL LH LL //

Q = Param( "% Change", 2, 0.1, 10, 0.1 );
Z = Zig( C , q ) ;
HH = ( ( Z < Ref( Z, -1 ) AND Ref( Z, -1 ) > Ref( Z, -2 ) ) AND (Peak( z, q, 1 ) > Peak( Z, q, 2 ) ) );
LH = ( ( Z < Ref( Z, -1 ) AND Ref( Z, -1 ) > Ref( Z, -2 ) ) AND (Peak( Z, q, 1 ) < Peak( Z, q, 2 ) ) );
HL = ( ( Z > Ref( Z, -1 ) AND Ref( Z, -1 ) < Ref( Z, -2 ) ) AND (Trough( Z, q, 1 ) > Trough( Z, q, 2 ) ) );
LL = ( ( Z > Ref( Z, -1 ) AND Ref( Z, -1 ) < Ref( Z, -2 ) ) AND (Trough( Z, q, 1 ) < Trough( Z, q, 2 ) ) );
GraphXSpace = 5;
dist = 0.5 * ATR( 20 );

for ( i = 0; i < BarCount; i++ )
{
    if ( HH[i] )
        PlotText( "HH", i, H[ i ] + dist[i], colorYellow );

    if ( LH[i] )
        PlotText( "LH", i, H[ i ] + dist[i], colorYellow );

    if ( HL[i] )
        PlotText( "HL", i, L[ i ] - dist[i], colorPink );

    if ( LL[i] )
        PlotText( "LL", i, L[ i ] - dist[i], colorPink );

}


_SECTION_END();

_SECTION_BEGIN("MA1");
P = ParamField("Price field",-1);
Periods = Param("Periods", 15, 2, 500, 1, 10 );
Plot( MA( P, Periods ), _DEFAULT_NAME(), ParamColor( "Color", colorCycle ), ParamStyle("Style") );
_SECTION_END();


//PIVOTS
///////////

pivbuy=  Ref(L,-1)<Ref(L,-2) AND L>Ref(L,-1) AND Ref(H,-1)<Ref(H,-2) AND H>Ref(H,-1) AND C>Ref(C,-2) ;
pivsell= Ref(H,-1)>Ref(H,-2) AND H<Ref(H,-1) AND Ref(L,-1)>Ref(L,-2) AND L<Ref(L,-1) AND C<Ref(C,-2) ;

Buy  = pivbuy ;
Sell = pivsell ;

Buy= ExRem(Buy,Sell) ;
Sell= ExRem(Sell,Buy) ;

PlotShapes(IIf(Buy,shapeUpArrow,shapeNone),colorBlue,0,L,Offset=-10);
PlotShapes(IIf(Sell,shapeDownArrow,shapeNone),colorRed,0,H,Offset=-10);
//xxxxxxxxxxxxxxxxxxxxxxxxxxxxxxxxxxxxxxxxxxxxxxxxxxxxxxxxxxxxxxxxxxxxxxxxxxxxxxxxxxxxxxxxxxx

//PRICE
_SECTION_BEGIN("Price");
SetChartOptions(0,chartShowArrows|chartShowDates);
_N(Title = StrFormat("{{NAME}} - {{INTERVAL}} {{DATE}} Open %g, Hi %g, Lo %g, Close %g (%.1f%%) Vol " +WriteVal( V, 1.0 ) +
          " {{VALUES}}", O, H, L, C, SelectedValue( ROC( C, 1 )) ));
Plot( C, "Close", ParamColor("Color", colorBlack ), styleNoTitle | ParamStyle("Style") | GetPriceStyle() );
if( ParamToggle("Tooltip shows", "All Values|Only Prices" ) )
{
 ToolTip=StrFormat("Open: %g\nHigh:  %g\nLow:   %g\nClose:  %g (%.1f%%)\nVolume: "+NumToStr( V, 1 ), O, H, L, C,
         SelectedValue( ROC( C, 1 )));
}
_SECTION_END();
//xxxxxxxxxxxxxxxxxxxxxxxxxxxxxxxxxxxxxxxxxxxxxxxxxxxxxxxxxxxxxxxxxxxxxxxxxxxxxxxxxxxxxxxxxxxxxx

//TRENDING RIBBON
// Paste the code below to your price chart somewhere and green ribbon means both
// both MACD and ADX trending up so if the red ribbon shows up the MACD and the ADX
// are both trending down.
_SECTION_BEGIN("trending ribbon");
uptrend= PDI()>MDI() AND MACD()>Signal() ;
downtrend= MDI()>PDI() AND Signal()>MACD() ;
Plot( 2, /* defines the height of the ribbon in percent of pane width */"",
IIf( uptrend AND EMA(C,50)>=Ref(EMA(C,50),-1), colorLime, IIf( downtrend OR EMA(C,50)<Ref(EMA(C,50),-1),
     colorRed, colorAqua )), /* choose color */
styleOwnScale|styleArea|styleNoLabel, -0.5, 100 );
_SECTION_END();
//xxxxxxxxxxxxxxxxxxxxxxxxxxxxxxxxxxxxxxxxxxxxxxxxxxxxxxxxxxxxxxxxxxxxxxxxxxxxxxxxxxxxxxxxxxxxxxxxxxxxxxx

_SECTION_BEGIN("Name");
GfxSetOverlayMode(1);
GfxSelectFont("Tahoma", Status("pxheight")/8 );
GfxSetTextAlign( 6 );// center alignment
GfxSetTextColor( ColorHSB( 42, 42, 42 ) );
GfxSetBkMode(0); // transparent
GfxTextOut( Name(), Status("pxwidth")/2, Status("pxheight")/12 );
GfxSelectFont("Tahoma", Status("pxheight")/18 );
GfxTextOut( IndustryID(1), Status("pxwidth")/2, Status("pxheight")/4 );

GfxSelectFont("Tahoma", Status("pxheight")/18 );
GfxSelectFont("Tahoma", Status("pxheight")/36 );
GfxTextOut( "PRASAD RAO", Status("pxwidth")/2, Status("pxheight")/3 );
_SECTION_END();

SetBarFillColor( IIf(O>C,colorDarkRed, colorBrightGreen ) );
Plot( C, "Price", IIf( O>C,colorRed, colorGreen ), styleCandle );

HaClose =EMA((O+H+L+C)/4,3);
HaOpen = AMA( Ref( HaClose, -1 ), 0.5 );
HaHigh = Max( H, Max( HaClose, HaOpen ) );
HaLow = Min( L, Min( HaClose, HaOpen ) );

_SECTION_BEGIN("Resistance");

supres=ParamToggle("Sup_Res","No|Yes",1);
if(supres)
{


Prd1=Param("Res_Period1",2,0,200,1);

test   = TEMA  ( High , Prd1 ) ;

PK = test > Ref(test,-1) AND Ref(test,1) < High;//Peak
PKV0 = ValueWhen(PK,haHigh,0);//PeakValue0
PKV1 = ValueWhen(PK,haHigh,1);//PeakValue1
PKV2 = ValueWhen(PK,haHigh,2);//PeakValue2

MPK = PKV2 < PKV1 AND PKV1 > PKV0 ;//MajorPeak

MPKV = ValueWhen(Ref(MPK,-1) == 0 AND MPK == 1, PKV1,1); //MajorPeakValue
MPKD = ValueWhen(Ref(MPK,-1) == 0 AND MPK == 1, DateNum(),1); //MajorPeakDate
SD = IIf(DateNum() < LastValue(MPKD,lastmode = True ), Null, LastValue(MPKV,Lastmode = True));//SelectedDate
Plot(SD, "Resist1",  colorBrown,ParamStyle("ResStyle1",styleLine|styleNoTitle,maskAll));

MPKV2 = ValueWhen(Ref(MPK,-1) == 0 AND MPK == 1, PKV1,2); //MajorPeakValue
MPKD2 = ValueWhen(Ref(MPK,-1) == 0 AND MPK == 1, DateNum(),2); //MajorPeakDate
SD2 = IIf(DateNum() < LastValue(MPKD2,lastmode = True ), Null, LastValue(MPKV2,Lastmode = True));//SelectedDate
Plot(SD2, "Resist2",  colorBrown,ParamStyle("ResStyle2",styleLine|styleNoTitle,maskAll));


MPKV3 = ValueWhen(Ref(MPK,-1) == 0 AND MPK == 1, PKV1,3); //MajorPeakValue
MPKD3 = ValueWhen(Ref(MPK,-1) == 0 AND MPK == 1, DateNum(),3); //MajorPeakDate
SD3 = IIf(DateNum() < LastValue(MPKD3,lastmode = True ), Null, LastValue(MPKV3,Lastmode = True));//SelectedDate
Plot(SD3, "Resist3", colorBrown,ParamStyle("ResStyle3",styleLine|styleNoTitle,maskAll));


MPKV4 = ValueWhen(Ref(MPK,-1) == 0 AND MPK == 1, PKV1,4); //MajorPeakValue
MPKD4 = ValueWhen(Ref(MPK,-1) == 0 AND MPK == 1, DateNum(),4); //MajorPeakDate
SD4 = IIf(DateNum() < LastValue(MPKD4,lastmode = True ), Null, LastValue(MPKV4,Lastmode = True));//SelectedDate
Plot(SD4, "Resist4",  colorBrown,ParamStyle("ResStyle4",styleLine|styleNoTitle,maskAll));


MPKV5 = ValueWhen(Ref(MPK,-1) == 0 AND MPK == 1, PKV1,5); //MajorPeakValue
MPKD5 = ValueWhen(Ref(MPK,-1) == 0 AND MPK == 1, DateNum(),5); //MajorPeakDate
SD5 = IIf(DateNum() < LastValue(MPKD5,lastmode = True ), Null, LastValue(MPKV5,Lastmode = True));//SelectedDate
Plot(SD5, "Resist5",  colorBrown,ParamStyle("ResStyle5",styleLine|styleNoTitle,maskAll));


MPKV6 = ValueWhen(Ref(MPK,-1) == 0 AND MPK == 1, PKV1,6); //MajorPeakValue
MPKD6 = ValueWhen(Ref(MPK,-1) == 0 AND MPK == 1, DateNum(),6); //MajorPeakDate
SD6 = IIf(DateNum() < LastValue(MPKD6,lastmode = True ), Null, LastValue(MPKV6,Lastmode = True));//SelectedDate
Plot(SD6, "Resist6", colorBrown ,ParamStyle("ResStyle6",styleLine|styleNoTitle,maskAll));


_SECTION_END();


_SECTION_BEGIN("Support");
//SP=L > Ref(L,-1) AND Ref(L,1) < L;//Peak

Prd2=Param("Sup_Period1",2,0,200,1);

test2   = TEMA ( Low , Prd2 ) ;

SP = Ref(test2,1) > Low AND test2 < Ref(test2,-1);//Peak
SPV0 = ValueWhen(SP,haLow,0);//PeakValue0
SPV1 = ValueWhen(SP,haLow,1);//PeakValue1
SPV2 = ValueWhen(SP,haLow,2);//PeakValue2

//PKV5 = ValueWhen(PK,haHigh,5);//PeakValue5
//PKV6 = ValueWhen(PK,haHigh,6);//PeakValue6

MSP = SPV2 > SPV1 AND SPV1 < SPV0 ;//MajorPeak

MSPV = ValueWhen(Ref(MSP,-1) == 0 AND MSP == 1, SPV1,1);
MSPD = ValueWhen(Ref(MSP,-1) == 0 AND MSP == 1, DateNum(),1);
SD = IIf(DateNum() < LastValue(MSPD,lastmode = True ), Null, LastValue(MSPV,Lastmode = True));
Plot(SD,"Support1",  colorPlum,ParamStyle("SupportLine1",styleLine|styleNoTitle,maskAll));


MSPV2 = ValueWhen(Ref(MSP,-1) == 0 AND MSP == 1, SPV1,2);
MSPD2 = ValueWhen(Ref(MSP,-1) == 0 AND MSP == 1, DateNum(),2);
SD2 = IIf(DateNum() < LastValue(MSPD2,lastmode = True ), Null, LastValue(MSPV2,Lastmode = True));
Plot(SD2,"Support2",  colorPlum,ParamStyle("SupportLine2",styleLine|styleNoTitle,maskAll));


MSPV3 = ValueWhen(Ref(MSP,-1) == 0 AND MSP == 1, SPV1,3);
MSPD3 = ValueWhen(Ref(MSP,-1) == 0 AND MSP == 1, DateNum(),3);
SD3 = IIf(DateNum() < LastValue(MSPD3,lastmode = True ), Null, LastValue(MSPV3,Lastmode = True));
Plot(SD3,"Support3",  colorPlum,ParamStyle("SupportLine3",styleLine|styleNoTitle,maskAll));


MSPV4 = ValueWhen(Ref(MSP,-1) == 0 AND MSP == 1, SPV1,4);
MSPD4 = ValueWhen(Ref(MSP,-1) == 0 AND MSP == 1, DateNum(),4);
SD4 = IIf(DateNum() < LastValue(MSPD4,lastmode = True ), Null, LastValue(MSPV4,Lastmode = True));
Plot(SD4,"Support4",  colorPlum,ParamStyle("SupportLine4",styleLine|styleNoTitle,maskAll));


MSPV5 = ValueWhen(Ref(MSP,-1) == 0 AND MSP == 1, SPV1,5);
MSPD5 = ValueWhen(Ref(MSP,-1) == 0 AND MSP == 1, DateNum(),5);
SD5 = IIf(DateNum() < LastValue(MSPD5,lastmode = True ), Null, LastValue(MSPV5,Lastmode = True));
Plot(SD5,"Support5",  colorPlum,ParamStyle("SupportLine5",styleLine|styleNoTitle,maskAll));


MSPV6 = ValueWhen(Ref(MSP,-1) == 0 AND MSP == 1, SPV1,6);
MSPD6 = ValueWhen(Ref(MSP,-1) == 0 AND MSP == 1, DateNum(),6);
SD6 = IIf(DateNum() < LastValue(MSPD6,lastmode = True ), Null, LastValue(MSPV6,Lastmode = True));
Plot(SD6,"Support6",  colorPlum,ParamStyle("SupportLine6",styleLine|stylehidden|styleNoTitle,maskAll));

}

_SECTION_END();

_SECTION_BEGIN("EMA1");
P = ParamField("Price field",-1);
Periods = Param("Periods", 15, 2, 300, 1, 10 );
Plot( EMA( P, Periods ), _DEFAULT_NAME(), ParamColor( "Color", colorCycle ), ParamStyle("Style") );
_SECTION_END();

_SECTION_BEGIN("EMA2");
P = ParamField("Price field",-1);
Periods = Param("Periods", 15, 2, 300, 1, 10 );
Plot( EMA( P, Periods ), _DEFAULT_NAME(), ParamColor( "Color", colorCycle ), ParamStyle("Style") );
_SECTION_END();

_SECTION_BEGIN("CandlePivots+trendline");
/////// advance trenlines with candle pivots ///////////////////
SetChartOptions(0, chartShowArrows | chartShowDates);
_N(Title = StrFormat("{{NAME}} - {{INTERVAL}} {{DATE}} ,{{VALUES}}", O, H, L, C, SelectedValue(ROC(C, 1))));
Plot(C, "", IIf(O >= C, colorOrange, colorGreen), styleCandle);
SetChartBkGradientFill(ParamColor("Inner panel upper", colorBlack), ParamColor("Inner panel lower", colorBlack));
_N(Title = EncodeColor(colorWhite) + StrFormat(" {{NAME}} - {{INTERVAL}} {{DATE}} Open:%g,high:%g,low:%g, Close:%g ,{{VALUES}}", O, H, L, C));
/////////////////////////////////////////////////////////////////////////////////////////////
farback = Param("How Far back to go", 100, 50, 5000, 10);
nBars = Param("Number of bars", 12, 5, 40);
aHPivs = H - H;
aLPivs = L - L;
aHPivHighs = H - H;
aLPivLows = L - L;
aHPivIdxs = H - H;
aLPivIdxs = L - L;
nHPivs = 0;
nLPivs = 0;
lastHPIdx = 0;
lastLPIdx = 0;
lastHPH = 0;
lastLPL = 0;
curPivBarIdx = 0;
aHHVBars = HHVBars(H, nBars);
aLLVBars = LLVBars(L, nBars);
aHHV = HHV(H, nBars);
aLLV = LLV(L, nBars);
aVisBars = Status("barvisible");
nLastVisBar = LastValue(Highest(IIf(aVisBars, BarIndex(), 0)));
_TRACE("Last visible bar: " + nLastVisBar);
curBar = (BarCount - 1);
curTrend = "";
if (aLLVBars[curBar] < aHHVBars[curBar])
{
    curTrend = "D";
}

else
{
    curTrend = "U";
}

for (i = 0; i < farback; i++)
{
    curBar = (BarCount - 1) - i;
    if (aLLVBars[curBar] < aHHVBars[curBar])
    {
        if (curTrend == "U")
        {
            curTrend = "D";
            curPivBarIdx = curBar - aLLVBars[curBar];
            aLPivs[curPivBarIdx] = 1;
            aLPivLows[nLPivs] = L[curPivBarIdx];
            aLPivIdxs[nLPivs] = curPivBarIdx;
            nLPivs++;
        }
    }
    else
    {
        if (curTrend == "D")
        {
            curTrend = "U";
            curPivBarIdx = curBar - aHHVBars[curBar];
            aHPivs[curPivBarIdx] = 1;
            aHPivHighs[nHPivs] = H[curPivBarIdx];
            aHPivIdxs[nHPivs] = curPivBarIdx;
            nHPivs++;
        }
    }
}

curBar = (BarCount - 1);
candIdx = 0;
candPrc = 0;
lastLPIdx = aLPivIdxs[0];
lastLPL = aLPivLows[0];
lastHPIdx = aHPivIdxs[0];
lastHPH = aHPivHighs[0];
if (lastLPIdx > lastHPIdx)
{
    candIdx = curBar - aHHVBars[curBar];
    candPrc = aHHV[curBar];
    if (lastHPH < candPrc AND candIdx > lastLPIdx AND candIdx < curBar)
    {
        aHPivs[candIdx] = 1;
        for (j = 0; j < nHPivs; j++)
        {
            aHPivHighs[nHPivs - j] = aHPivHighs[nHPivs - (j + 1)];
            aHPivIdxs[nHPivs - j] = aHPivIdxs[nHPivs - (j + 1)];
        }
        aHPivHighs[0] = candPrc;
        aHPivIdxs[0] = candIdx;
        nHPivs++;
    }
}

else
{
    candIdx = curBar - aLLVBars[curBar];
    candPrc = aLLV[curBar];
    if (lastLPL > candPrc AND candIdx > lastHPIdx AND candIdx < curBar)
    {
        aLPivs[candIdx] = 1;
        for (j = 0; j < nLPivs; j++)
        {
            aLPivLows[nLPivs - j] = aLPivLows[nLPivs - (j + 1)];
            aLPivIdxs[nLPivs - j] = aLPivIdxs[nLPivs - (j + 1)];
        }
        aLPivLows[0] = candPrc;
        aLPivIdxs[0] = candIdx;
        nLPivs++;
    }
}

for (k = 0; k < nHPivs; k++)
{
    _TRACE("High pivot no. " + k + " at barindex: " + aHPivIdxs[k] + ", " + WriteVal(ValueWhen(BarIndex() == aHPivIdxs[k], DateTime(), 1), formatDateTime) + ", " + aHPivHighs[k]);
}

a1 = ahpivs == 1;
a2 = alpivs == 1;
PlotShapes(a1 *shapeSmallCircle, colorRed, 0, H, Offset = 5);
PlotShapes(a2 *shapeSmallCircle, colorGreen, 0, L, Offset = -5);
//////////////////////////////////////////////////////

Para = ParamToggle("Plot Parallel Lines","Off,On");
ColorS= ParamColor("Support",colorLime);
ColorR= ParamColor("Resistance",colorRed);
x = Cum(1);
s1 = L;
s11 = H;
pS = a2 == 1;


endt = LastValue(ValueWhen(ps,x,1));
startt = LastValue(ValueWhen(ps,x,2));
ends = LastValue(ValueWhen(ps,S1,1));
starts = LastValue(ValueWhen(ps,S1,2));
dtS = endt - startt;
aS = (endS - startS) / dtS;
bS = endS;
trendlineS = aS *(x - endt) + bS;
g3 = IIf(x > startt - 10, trendlineS,  Null);
Plot(g3, "", colors, styleThick);
pR = a1 == 1;
endt1 = LastValue(ValueWhen(pr,x,1));
startt1 = LastValue(ValueWhen(pr,x,2));
endr = LastValue(ValueWhen(pr,S11,1));
startr = LastValue(ValueWhen(pr,S11,2));
dtR = endt1 - startt1;
aR = (endR - startR) / dtR;
bR = endR;
trendlineR = aR *(x - endt1) + bR;
g4 = IIf(x > startT1 - 10, trendlineR,  Null);
Plot(g4, "", colorr, styleThick);

acd = log(endr/startr)/(endt1-startt1);
res1 = exp((x-endt1)*acd)*endr;
RRL = ROC(res1,1);
bcd = log(ends/starts)/(endt-startt);
sup1= exp((x-endt)*bcd)*ends;
RSL = ROC(sup1,1);

Low_Value = LastValue(Ref(LLV(L,endt1-startt1),-(x-endt1)));
x2 = LastValue(ValueWhen(L==Low_Value & x>startt1 & x<endt1,x));
PLL = IIf(LastValue(x)-x2>5,exp((x-x2)*acd)*Low_Value,Null);
Hi_Value = LastValue(Ref(HHV(H,endt-startt),-(x-endt)));
x3 = LastValue(ValueWhen(H==Hi_Value & x>startt & x<endt,x));
PHL = IIf(LastValue(x)-x3>5,exp((x-x3)*bcd)*Hi_Value,Null);
SLabs = sup1-Ref(sup1,-1); RLabs = res1-Ref(res1,-1);
ROC2SL = (SLabs/C)*100; ROC2RL = (RLabs/C)*100;
PLLd = abs((LastValue(C)/LastValue(PLL))-1)<0.01*100;
PHLd = abs((LastValue(C)/LastValue(PHL))-1)<0.01*100;
barvisible = Status("barvisible");
firstvisiblebar = barvisible & NOT
Ref(barvisible,-1);
HHvisible = LastValue(HighestSince(firstvisiblebar,High));
LLvisible = LastValue(LowestSince(firstvisiblebar,Low));
RaH = HHvisible *1.05; RaL = LLVisible *0.95;
AnZ= starts==0 OR ends==0 OR startr==0 OR endr==0;
PLplot = IIf(x-x2>=0 & abs(LastValue(L/PLL)-1) <abs(LastValue((100/1000)*ATR(14))) & PLL>RaL & PLL<RaH & NOT AnZ,PLL,IIf(x-x2>=0 & RaL==0 & PLLd & abs(LastValue(L/PLL)-1) <abs(LastValue((100/1000)*ATR(14)))& NOT AnZ,PLL,Null));
PHplot = IIf(x-x3>=0 & abs(LastValue(H/PHL)-1) <abs(LastValue((100/1000)*ATR(14))) & PHL>RaL & PHL<RaH & NOT AnZ,PHL,IIf(x-x3>=0 & RaL==0 & PHLd & abs(LastValue(H/PHL)-1) <abs(LastValue((100/1000)*ATR(14)))& NOT AnZ,PHL,Null));
Plot(IIf(Para,PLplot,Null)," ",colorr,styleDashed,maskDefault+styleNoRescale);
Plot(IIf(Para,PHplot,Null)," ",colors,styleDashed,maskDefault+styleNoRescale);
_SECTION_END();
13 comments
Leave Comment
Please login here to leave a comment.
please show me some similar ones.
There are a few formulas on this site which are very similar trendlines, pivots, ma etc combined. I do not remember the names.
I have awarded you credit for the effort.
Any specific reason for not approving the afl???
Admin,
Kindly approve the above formula – looks Good.
Or else.. pls provide link for similiar formula on this website.
Thanx you, waiting for ur reply
Thanx you Admin,
for approving my fav Author Kelvinhand’s Formula
Really helpful..
I havnt seen any such combination on this website in one formula.
If u know.. paste me the link for the same.
Thanx you again.
I cannot imagine that somebody gives 5 stars to such a treacherous code that clearly looks into the future…..
after too many afls it is not easy to make any new afl or new idea but this afl is one of the best idea how to mix all possible good things in one package. all important things has been added.
Thnx Admin For Supporting me in Approving this Formula. Thnx to all who Suppoerted my effort.
My Idea is Why put many Afls . Go for One Which gives all info. I am trying to do some more additions to the Formula. Wish me Good Luck.
One More important thing. From Parameters parallel Lines could also be displayed. Try that.thanx a lot
thanks a lot
Hi,
Thanks for all the effort you did on this to put it here.
Good work.
woow very good
lỗi rồi tiếc quá