Candle pivots with trendlines for Amibroker (AFL)
joeoil over 15 years ago Amibroker (AFL)
Hi
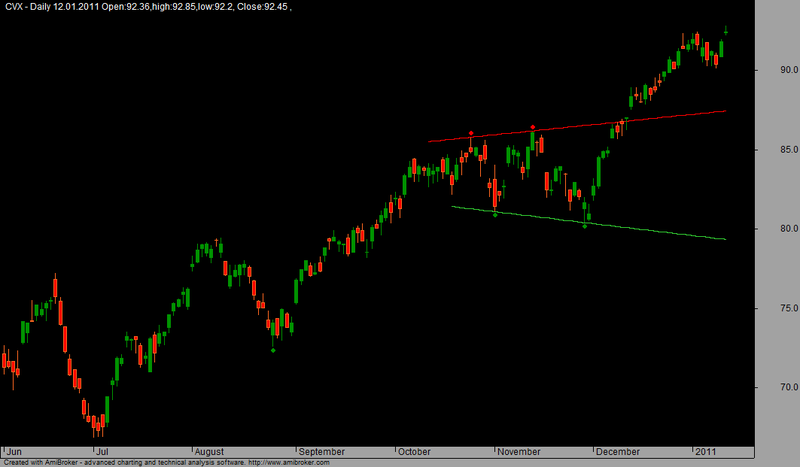
Here’s an indicator with candle pivots and trendlines. I have not used it by myself. I think it was written/posted on a TA forum by a person called “priyavardana”.
Regards
Joeoil
Screenshots
Indicator / Formula
Copy & Paste Friendly
/////// advance trenlines with candle pivots ///////////////////
SetChartOptions(0, chartShowArrows | chartShowDates);
_N(Title = StrFormat("{{NAME}} - {{INTERVAL}} {{DATE}} ,{{VALUES}}", O, H, L, C, SelectedValue(ROC(C, 1))));
Plot(C, "", IIf(O >= C, colorOrange, colorGreen), styleCandle);
SetChartBkGradientFill(ParamColor("Inner panel upper", colorBlack), ParamColor("Inner panel lower", colorBlack));
_N(Title = EncodeColor(colorWhite) + StrFormat(" {{NAME}} - {{INTERVAL}} {{DATE}} Open:%g,high:%g,low:%g, Close:%g ,{{VALUES}}", O, H, L, C));
/////////////////////////////////////////////////////////////////////////////////////////////
farback = Param("How Far back to go", 100, 50, 5000, 10);
nBars = Param("Number of bars", 12, 5, 40);
aHPivs = H - H;
aLPivs = L - L;
aHPivHighs = H - H;
aLPivLows = L - L;
aHPivIdxs = H - H;
aLPivIdxs = L - L;
nHPivs = 0;
nLPivs = 0;
lastHPIdx = 0;
lastLPIdx = 0;
lastHPH = 0;
lastLPL = 0;
curPivBarIdx = 0;
aHHVBars = HHVBars(H, nBars);
aLLVBars = LLVBars(L, nBars);
aHHV = HHV(H, nBars);
aLLV = LLV(L, nBars);
aVisBars = Status("barvisible");
nLastVisBar = LastValue(Highest(IIf(aVisBars, BarIndex(), 0)));
_TRACE("Last visible bar: " + nLastVisBar);
curBar = (BarCount - 1);
curTrend = "";
if (aLLVBars[curBar] < aHHVBars[curBar])
{
    curTrend = "D";
}

else
{
    curTrend = "U";
}

for (i = 0; i < farback; i++)
{
    curBar = (BarCount - 1) - i;
    if (aLLVBars[curBar] < aHHVBars[curBar])
    {
        if (curTrend == "U")
        {
            curTrend = "D";
            curPivBarIdx = curBar - aLLVBars[curBar];
            aLPivs[curPivBarIdx] = 1;
            aLPivLows[nLPivs] = L[curPivBarIdx];
            aLPivIdxs[nLPivs] = curPivBarIdx;
            nLPivs++;
        }
    }
    else
    {
        if (curTrend == "D")
        {
            curTrend = "U";
            curPivBarIdx = curBar - aHHVBars[curBar];
            aHPivs[curPivBarIdx] = 1;
            aHPivHighs[nHPivs] = H[curPivBarIdx];
            aHPivIdxs[nHPivs] = curPivBarIdx;
            nHPivs++;
        }
    }
}

curBar = (BarCount - 1);
candIdx = 0;
candPrc = 0;
lastLPIdx = aLPivIdxs[0];
lastLPL = aLPivLows[0];
lastHPIdx = aHPivIdxs[0];
lastHPH = aHPivHighs[0];
if (lastLPIdx > lastHPIdx)
{
    candIdx = curBar - aHHVBars[curBar];
    candPrc = aHHV[curBar];
    if (lastHPH < candPrc AND candIdx > lastLPIdx AND candIdx < curBar)
    {
        aHPivs[candIdx] = 1;
        for (j = 0; j < nHPivs; j++)
        {
            aHPivHighs[nHPivs - j] = aHPivHighs[nHPivs - (j + 1)];
            aHPivIdxs[nHPivs - j] = aHPivIdxs[nHPivs - (j + 1)];
        }
        aHPivHighs[0] = candPrc;
        aHPivIdxs[0] = candIdx;
        nHPivs++;
    }
}

else
{
    candIdx = curBar - aLLVBars[curBar];
    candPrc = aLLV[curBar];
    if (lastLPL > candPrc AND candIdx > lastHPIdx AND candIdx < curBar)
    {
        aLPivs[candIdx] = 1;
        for (j = 0; j < nLPivs; j++)
        {
            aLPivLows[nLPivs - j] = aLPivLows[nLPivs - (j + 1)];
            aLPivIdxs[nLPivs - j] = aLPivIdxs[nLPivs - (j + 1)];
        }
        aLPivLows[0] = candPrc;
        aLPivIdxs[0] = candIdx;
        nLPivs++;
    }
}

for (k = 0; k < nHPivs; k++)
{
    _TRACE("High pivot no. " + k + " at barindex: " + aHPivIdxs[k] + ", " + WriteVal(ValueWhen(BarIndex() == aHPivIdxs[k], DateTime(), 1), formatDateTime) + ", " + aHPivHighs[k]);
}

a1 = ahpivs == 1;
a2 = alpivs == 1;
PlotShapes(a1 *shapeSmallCircle, colorRed, 0, H, Offset = 5);
PlotShapes(a2 *shapeSmallCircle, colorGreen, 0, L, Offset = -5);
//////////////////////////////////////////////////////

Para = ParamToggle("Plot Parallel Lines","Off,On");
ColorS= ParamColor("Support",colorLime);
ColorR= ParamColor("Resistance",colorRed);
x = Cum(1);
s1 = L;
s11 = H;
pS = a2 == 1;


endt = LastValue(ValueWhen(ps,x,1));
startt = LastValue(ValueWhen(ps,x,2));
ends = LastValue(ValueWhen(ps,S1,1));
starts = LastValue(ValueWhen(ps,S1,2));
dtS = endt - startt;
aS = (endS - startS) / dtS;
bS = endS;
trendlineS = aS *(x - endt) + bS;
g3 = IIf(x > startt - 10, trendlineS,  Null);
Plot(g3, "", colors, styleThick);
pR = a1 == 1;
endt1 = LastValue(ValueWhen(pr,x,1));
startt1 = LastValue(ValueWhen(pr,x,2));
endr = LastValue(ValueWhen(pr,S11,1));
startr = LastValue(ValueWhen(pr,S11,2));
dtR = endt1 - startt1;
aR = (endR - startR) / dtR;
bR = endR;
trendlineR = aR *(x - endt1) + bR;
g4 = IIf(x > startT1 - 10, trendlineR,  Null);
Plot(g4, "", colorr, styleThick);

acd = log(endr/startr)/(endt1-startt1);
res1 = exp((x-endt1)*acd)*endr;
RRL = ROC(res1,1);
bcd = log(ends/starts)/(endt-startt);
sup1= exp((x-endt)*bcd)*ends;
RSL = ROC(sup1,1);

Low_Value = LastValue(Ref(LLV(L,endt1-startt1),-(x-endt1)));
x2 = LastValue(ValueWhen(L==Low_Value & x>startt1 & x<endt1,x));
PLL = IIf(LastValue(x)-x2>5,exp((x-x2)*acd)*Low_Value,Null);
Hi_Value = LastValue(Ref(HHV(H,endt-startt),-(x-endt)));
x3 = LastValue(ValueWhen(H==Hi_Value & x>startt & x<endt,x));
PHL = IIf(LastValue(x)-x3>5,exp((x-x3)*bcd)*Hi_Value,Null);
SLabs = sup1-Ref(sup1,-1); RLabs = res1-Ref(res1,-1);
ROC2SL = (SLabs/C)*100; ROC2RL = (RLabs/C)*100;
PLLd = abs((LastValue(C)/LastValue(PLL))-1)<0.01*100;
PHLd = abs((LastValue(C)/LastValue(PHL))-1)<0.01*100;
barvisible = Status("barvisible");
firstvisiblebar = barvisible & NOT
Ref(barvisible,-1);
HHvisible = LastValue(HighestSince(firstvisiblebar,High));
LLvisible = LastValue(LowestSince(firstvisiblebar,Low));
RaH = HHvisible *1.05; RaL = LLVisible *0.95;
AnZ= starts==0 OR ends==0 OR startr==0 OR endr==0;
PLplot = IIf(x-x2>=0 & abs(LastValue(L/PLL)-1) <abs(LastValue((100/1000)*ATR(14))) & PLL>RaL & PLL<RaH & NOT AnZ,PLL,IIf(x-x2>=0 & RaL==0 & PLLd & abs(LastValue(L/PLL)-1) <abs(LastValue((100/1000)*ATR(14)))& NOT AnZ,PLL,Null));
PHplot = IIf(x-x3>=0 & abs(LastValue(H/PHL)-1) <abs(LastValue((100/1000)*ATR(14))) & PHL>RaL & PHL<RaH & NOT AnZ,PHL,IIf(x-x3>=0 & RaL==0 & PHLd & abs(LastValue(H/PHL)-1) <abs(LastValue((100/1000)*ATR(14)))& NOT AnZ,PHL,Null));
Plot(IIf(Para,PLplot,Null)," ",colorr,styleDashed,maskDefault+styleNoRescale);
Plot(IIf(Para,PHplot,Null)," ",colors,styleDashed,maskDefault+styleNoRescale);
4 comments
Leave Comment
Please login here to leave a comment.
good one , i like it, simple but effective
Thanks.
But can trade using this in intraday.The pivots appear based on the future prices.
Can we make it suitable for intraday trading by tweaking some of the parameter?
Pl.help.
Thanks,
Gopal
Same as Zig indicator. This pivots only play on backtest.
It cannot be used in real trade. Watch out!
@futat and @all
every indicator using future data CAN be used on scanner or exploration mode, as there are not known future bars if you scan od daily basis.
at the same time you CAN’T use it in backtesting mode as it give you false and exceptional results.