_MultiShow Indicator for Amibroker (AFL)
Dryden about 13 years ago Amibroker (AFL)
This indicator let’s you select MA / EMA / DEMA and others.
It let you decide where it should be calculated off, like the DPO, close or RSI or RSI based on DPO.
You can select your own favorite combo.
All selectable in parameters when displaying the indicator.
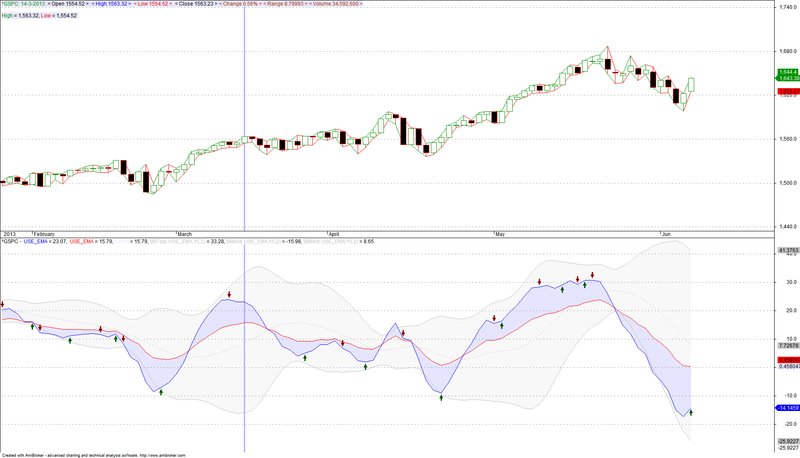
There are opportunities when the bands narrow, so I added one criteria which allows you to pick tops and bottoms.
Screenshots
Indicator / Formula
Copy & Paste Friendly
_SECTION_BEGIN("_MultiShow Indicator");

GraphXSpace = 25;

////////////////////////////////////////////////////////////////////////////////
function DetrendedPriceOsc( Periods )
{

 return C- AMA(Ref( MA( C, Periods ), -( 1 + Periods/2 ) ),0.5);
}
////////////////////////////////////////////////////////////////////////////////

indyOpt	= ParamList("Indicator", "EMA|MA|TEMA|DEMA|WMA|Wilders");
periods	= Optimize("periods ",Param("DPO/RSI periods ",7,1,50,1),1,50,2);
Fast		= Optimize("Fast",Param("Fast-Line ( blue )",9,1,28,1),1,28,1);
Slow		= Optimize("Slow",Param("Slow-Line ( red )",26,1,28,1),1,28,1);
Base		= ParamList("Based On", "DPO|Close|SmoothRSI");

//smoothRSI start
Hc=(O+H+L+C)/4;
Ho = AMA( Ref( Hc,  -1 ),  0.5 );
myArray = (RSIa( C,periods )+  RSIa( Ho,periods ) + Ref(RSIa(Ho,periods ),-3))/3 ;
showsignal = 0;
sameline = 0;
//smoothRSI end

switch (Base)
{
	case "DPO":
       ArrayBase = DetrendedPriceOsc( Periods );
       break;

	case "Close":
       ArrayBase = Close;
       break;

	case "SmoothRSI":
       ArrayBase = myArray ;
		showsignal = 1;
		sameline = 1;
       break;
}

switch (indyOpt)
{
	case "EMA":
       ArrayFast = EMA( ArrayBase, Fast );
		ArraySlow = EMA( ArrayBase, Slow );
       break;

	case "MA":
       ArrayFast = MA ( ArrayBase, Fast );
		ArraySlow = MA ( ArrayBase, Slow );
       break;

	case "TEMA":
       ArrayFast = TEMA ( ArrayBase, Fast );
		ArraySlow = TEMA ( ArrayBase, Slow );
       break;

	case "DEMA":
       ArrayFast = DEMA ( ArrayBase, Fast );
		ArraySlow = DEMA ( ArrayBase, Slow );
       break;

	case "WMA":
       ArrayFast = WMA( ArrayBase, Fast );
		ArraySlow = WMA( ArrayBase, Slow );
       break;

	case "Wilders":
       ArrayFast = Wilders ( ArrayBase, Fast );
		ArraySlow = Wilders ( ArrayBase, Slow );
       break;
}

Shortname = " USE_"+indyOpt+"";
Plot ( ArrayFast , Shortname , colorBlue);
Plot ( ArraySlow , Shortname , colorRed);
PlotOHLC (ArrayFast ,ArrayFast ,ArraySlow ,ArraySlow ,"Cloud",ColorBlend( colorWhite, colorBlue, 0.1 ), styleCloud | styleNoRescale, Null, Null, Null, -1 );

_SECTION_END();

//////////////////////////////////////////////////////////////////////////////

_SECTION_BEGIN("Buy/Sell Criteria");

//Common Criteria (CC)
CC1 = (Open > Close OR Open < Close);

//Criteria Long (CL);
CL1 = (ArraySlow -ArrayFast ) < Ref((ArraySlow -ArrayFast ),-1) ;

//Criteria Short (CS);
CS1 = (ArraySlow -ArrayFast ) > Ref((ArraySlow -ArrayFast ),-1) ;

BuyCriteria = CC1 AND CL1 ;
SellCriteria = CC1 AND CS1 ;

Buy = BuyCriteria ;
Sell=0;
Short =  SellCriteria ;
Cover=0;

Buy=ExRem(Buy,Short);
Short=ExRem(Short,Buy);

PlotShapes( Buy * shapeUpArrow , colorGreen, 0);
PlotShapes( Short * shapeDownArrow , colorRed, 0);

_SECTION_END();

//////////////////////////////////////////////////////////////////////////////

//smoothRSI start for lines
if (showsignal == 1)
{
Plot(80,"RESISTENCE",colorRed, styleLine|styleDashed | styleThick);
Plot(50,"",colorBlack, styleLine|styleDashed | styleThick);
Plot(20,"SUPPORT",colorBlue, styleLine|styleDashed | styleThick);
}

if (sameline == 1)
{
Plot( myArray , " RSI ", IIf( myArray > Ref(myArray ,-1), colorGreen, colorRed ),styleThick);
}

//smoothRSI end for lines

//////////////////////////////////////////////////////////////////////////////

_SECTION_BEGIN("Ribbon");
ShowRibbon = ParamToggle("Ribbon","No|Yes",1);
uptrend = BuyCriteria  ;
downtrend = SellCriteria ;
if (ShowRibbon ) Plot( 2, "Ribbon",IIf( uptrend, colorBrightGreen, IIf( downtrend, colorLightOrange, colorLavender )), styleOwnScale|styleArea|styleNoLabel, -0.5, 100 );
_SECTION_END();

//////////////////////////////////////////////////////////////////////////////

_SECTION_BEGIN("Bollinger Bands (Area)");
PField = ParamField("Price field",-1);
BBPeriods = Param("Period", 15, 2, 100, 1 );
BBWidth = Param("Width", 2, 0, 10, 0.05 );
BBColor = ParamColor("Color", colorLightGrey );
BBStyle = ParamStyle("Style") | styleNoRescale;;
Plot( bbt = BBandTop( PField , BBPeriods , BBWidth ), "BBTop" + _PARAM_VALUES(), BBColor , BBStyle );
Plot( bbb = BBandBot( PField , BBPeriods , BBWidth ), "BBBot" + _PARAM_VALUES(), BBColor , BBStyle );
PlotOHLC( bbt, bbt, bbb, bbb, "", ColorBlend( BBColor , colorWhite, 0.9 ), styleCloud | styleNoRescale, Null, Null, Null, -1 );
bbm = ((bbt +bbb )/2);
Plot( bbm , "BBMid" + _PARAM_VALUES(), BBColor , styleDashed );
_SECTION_END();

//////////////////////////////////////////////////////////////////////////////
0 comments
Leave Comment
Please login here to leave a comment.