Profit Trading System with BUY SELL Indicators for Amibroker (AFL)
samkum almost 13 years ago Amibroker (AFL)
Modified Profit Trading System with BUY SELL Indicators
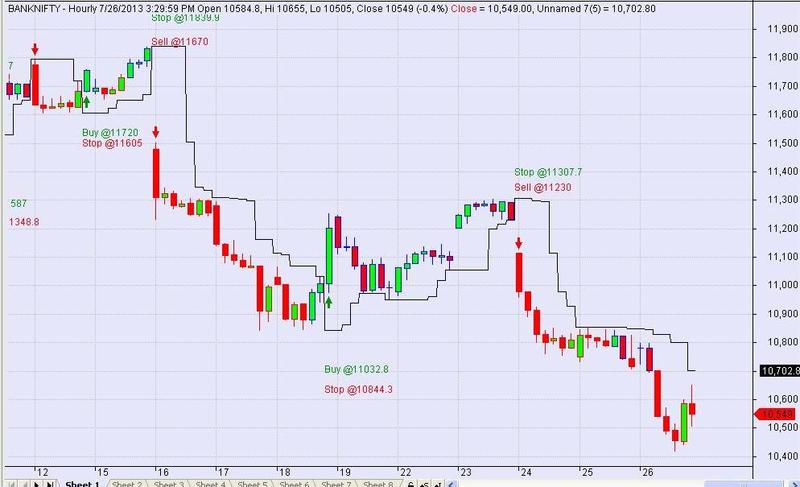
Screenshots
Indicator / Formula
Copy & Paste Friendly
_SECTION_BEGIN("Price");
SetChartOptions(0,chartShowArrows|chartShowDates);
_N(Title = StrFormat("{{NAME}} - {{INTERVAL}} {{DATE}} Open %g, Hi %g, Lo %g, Close %g (%.1f%%) {{VALUES}}", O, H, L, C, SelectedValue( ROC( C, 1 ) ) ));

SD = StochD(8, 3, 3);
MH = MACD(8, 21) - Signal(8, 21, 5);

trendup = IIf(MH > 0 OR (MH > 0 AND MH > Ref(MH, -1)) AND RSI(3) >50 AND SD < 80 AND SD > Ref(SD, -1) AND ValueWhen(C,O<C), colorBlue, colorWhite);
trendcolor = IIf(MH < 0 OR (MH < 0 AND MH < Ref(MH, -1)) AND RSI(3) <50 AND SD > 20 AND SD < Ref(SD, -1) AND ValueWhen(C,O>C), colorRed, trendup);
Plot( C, "Close", trendcolor, styleCandle | styleThick );

_SECTION_END();

no=Param( "Swing", 5, 1, 55 );

res=HHV(H,no);
sup=LLV(L,no);
tsl=IIf(ValueWhen(IIf(C>Ref(res,-1),1,IIf(C<Ref(sup,-1),-1,0))!=0,IIf(C>Ref(res,-1),1,IIf(C<Ref(sup,-1),-1,0)),1)==1,sup,res);

Plot(tsl, _DEFAULT_NAME(), colorBlack, styleStaircase);
Buy = Cross(C,res) ;
Sell = Cross(sup,C)  ;
_SECTION_END();


a=C;
g=(EMA(Close,3) * (2 / 4 - 1)-EMA(Close,5) * (2 / 6 - 1)) / (2 /4- 2 /6);
e=Ref(tsl,-1);
Buy = Cross(C,tsl) ;
Sell = Cross(tsl,C)  ;
SellPrice=ValueWhen(Sell,e,1);
BuyPrice=ValueWhen(Buy,e,1);
Long=Flip(Buy,Sell);
Shrt=Flip(Sell,Buy );
Filter=Buy OR Sell;
Buy = Cross(C,tsl) ;
Sell = Cross(tsl,C)  ;
shape = Buy * shapeUpArrow + Sell * shapeDownArrow;

PlotShapes( shape, IIf( Buy, colorGreen, colorRed ),0, IIf( Buy, Low, High ) );
a1=Ref(tsl,-1);
GraphXSpace = 5;
dist = 2*ATR(5);
for( i = 0; i < BarCount; i++ )
{if( Buy[i] ) PlotText( "Buy @" + a1[ i ], i, L[ i ]-dist[i], colorGreen );
if( Sell[i] ) PlotText( "Sell @" + a1[ i ], i, H[ i ]+dist[i], colorRed);
}


GraphXSpace = 5;
dist = 2.5*ATR(5);
for( i = 0; i < BarCount; i++ )
{if( Buy[i] ) PlotText( "Stop @" + tsl[ i ], i, L[ i ]-dist[i], colorRed );
if( Sell[i] ) PlotText( "Stop @" + tsl[ i ], i, H[ i ]+dist[i], colorGreen);
}
7 comments
Leave Comment
Please login here to leave a comment.
hi samkum thanks to plotting buy sell signals in my Profit Trading System,
give me ur mail id, sharing my other concepts with u for making afls.
thanks again
Murali Krishna
krishna_vaastu@yahoo.com
any new formulla pls contact me by mail kish.radhi@gmail.com
nice afl
afl is very gud but Target Price is not there
Great AFL.
Hi
Good work dear friend,
I have spotted an error which if you can rectify, it would be great.
The Stop Loss moves away from price on several occasions when price breaches the level.
For Example :
Trade long at 100
Stop loss at 98
when price breaches 98, SL revises to 97.5 when bar gets completed.
In fact, in live markets, the trade is squared and reversed.
Please disallow change of stop loss in this fashion (i.e. SL can only move up from previous bar SL in case of Long Trade and cannot move down , and vice a versa)
Please post revised version.
Thanks,
MotaSheth
PLS FIND THE AFL WITH TGT