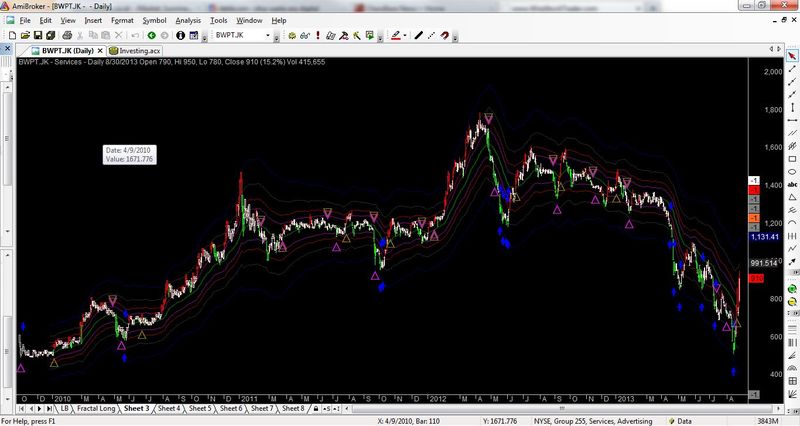
Yancedolly Bands V.3. for Amibroker (AFL)
yancedolly almost 13 years ago Amibroker (AFL)
Combine TSL and DownTrend Formula. Try This…. !!!
Screenshots
Indicator / Formula
Copy & Paste Friendly
_SECTION_BEGIN("Background Color");
BKswitch = ParamToggle("Background Color","On,Off");

OUTcolor =colorBlack;// ParamColor("Outer Panel Color",colorBlack);
INUPcolor =colorBlack;// ParamColor("Inner Panel Upper",colorBlack);
INDNcolor =colorBlack;// ParamColor("Inner Panel Lower",colorBlack);
TitleColor =colorBlack;// ParamColor("Title Color ",colorBlack);

if (NOT BKswitch)
{
SetChartBkColor(OUTcolor); // color of outer border
SetChartBkGradientFill(INUPcolor,INDNcolor,TitleColor); // color of inner panel
}
_SECTION_END();

_SECTION_BEGIN("Parameter Color");
Line1=17;//ParamColor("Line Yancedolly Bands Medium Cycle Color",17);
Line2=6;//ParamColor("Line Yancedolly Bands Short Cycle Color",6);
Line3=9;//ParamColor("Line Floor Top Color",9);
Peak_valley_color=ColorRGB(0,0,23);//ParamColor("Peak_valley_color",colorPaleBlue);
Vol1=colorDarkGreen;//ParamColor("Vol Up Color",colorDarkGreen);
Vol2=colorDarkRed;//ParamColor("Vol Down Color",colorDarkRed);
Vol3=colorDarkGrey;//ParamColor("Vol Avarage Color",23);
price1=colorRose;//ParamColor("Price Color",colorRose);
price2=colorBrightGreen;//ParamColor("Price Down Color",colorBrightGreen);
price3=colorRed;//ParamColor("Price Up Color",colorRed);
_SECTION_END();

_SECTION_BEGIN("Volume");
/* basic variable defs
 ud: up-Day (Close up from Open)
 dd: down-Day (Close down from Open)
 uc: up-Close (Close up from previous Close)
 dc: down-Close: (Close down from previous Close)
*/
C1 = Ref(C, -1);
uc = C > C1; dc = C <= C1;
ud = C > O; dd = C <= O;

/*
Volume Day types:
 green: up-day and up-close
 yellow: up-day but down-close
 red: down-day and down-close
 blue: down-day but up-close
 white: close equals open, close equals previous close

(currently unused vtypes are for future enhancements)
*/
green = 1; blue = 2; yellow = 3; red = 4; white = 5;
VType = IIf(ud,
            IIf(uc, green, yellow),
         IIf(dd,
            IIf(dc, red, blue), white));

/* green volume: up-day and up-close*/
gv = IIf(VType == green, V, 0);
/* yellow volume: up-day but down-close */
yv = IIf(VType == yellow, V, 0);
/* red volume: down-day and down-close */
rv = IIf(VType == red, V, 0);
/* blue volume: down-day but up-close */
bv = IIf(VType == blue, V, 0);
if (NOT ParamToggle("Volume Switch","On,Off"))
{
Plot( Volume, _DEFAULT_NAME(), IIf( VType==green OR VType==blue, Vol1, Vol2), styleNoTitle | ParamStyle( "Style", styleHistogram | styleOwnScale | styleThick | styleNoLabel, maskHistogram  ), 2 );
Plot(MA(Volume,5/*Param("MA Periods",5,5,50,1)*/),"",Vol3,styleLine |styleOwnScale ,5/*Param("Scale",5,1,20,1)*/);
}
_SECTION_END();
_SECTION_BEGIN("Price");
K1=5;// Param("EMA Periods?",5,3,50);
K2=10;// Param("ATR Periods?",10,2,50);
Mul=1;//Param("ATR Multiplier?",1,0.5,5,0.5);
Mi=EMA(C, K1);
Kel= ATR(K2)*Mul;
UB= Mi + Kel;
LB= Mi - Kel;
GraphXSpace = 5;
SetChartOptions( 0, chartShowDates | chartShowArrows | chartLogarithmic | chartWrapTitle );
_N( Title = StrFormat( "{{NAME}} - " + SectorID( 1 ) + " - {{INTERVAL}} {{DATE}} Open %g, Hi %g, Lo %g, Close %g (%.1f%%) Vol " + WriteVal( V, 1.0 ) + " {{VALUES}}", O, H, L, C, SelectedValue( ROC( C, 1 ) ) ) );
Plot(C,"", IIf(L<=LB,price2,IIf(H>=UB,price3,price1)),styleCandle);
_SECTION_END();


_SECTION_BEGIN("Automatic Fibonacci");
// Get values for fib levels

StartBar=SelectedValue(BarIndex());
FinishBar = EndValue( BarIndex() );
i = startbar;
period = FinishBar - StartBar;

Lo =LLV(L,period);
Hi = HHV(H,period);
Line0 = 0;
Line1 = 0;
Line2 = 0;
Line3 = 0;
Line4= 0;
Line5= 0;
Line6= 0;
Line7= 0;
Line100 = 0;

for( i = startbar; i < finishbar; i++ )
{
if(EndValue(C)<SelectedValue(C))
{
Line0  = EndValue(Lo);
Line100 = EndValue(Hi);
Line1 = Line0 + abs(Line100-Line0)*0.236;
Line2 = Line0 + abs(Line100-Line0)*0.382;
Line3 = Line0 + abs(Line100-Line0)*0.5;
Line4 = Line0 + abs(Line100-Line0)*0.618;
Line5 = Line0 + abs(Line100-Line0)*0.786;
Line6 = Line0 + abs(Line100-Line0)*1.618;
Line7 = Line0 + abs(Line100-Line0)*2.618;

}
else
{
Line100  = EndValue(Lo);
Line0 = EndValue(Hi);
Line1 =Line0 - abs(Line100-Line0)*0.236;
Line2 = Line0 - abs(Line100-Line0)*0.382;
Line3 = Line0 - abs(Line100-Line0)*0.5;
Line4 = Line0 - abs(Line100-Line0)*0.618;
Line5 = Line0 - abs(Line100-Line0)*0.786;
Line6 = Line0 - abs(Line100-Line0)*1.618;
Line7 = Line0 - abs(Line100-Line0)*2.618;

}
}

// external fib lines begining fom selecetdbarindex()
fib0= LineArray(startbar, Line0, finishbar, Line0, 0, 1);
fib100 = LineArray(startbar, Line100, finishbar, Line100, 0, 1);

// depth of middle lines
n= round((finishbar-startbar)/2);

// middle lines
fib1= LineArray((finishbar-n), Line1, finishbar, Line1, 0, 1);
fib2= LineArray((finishbar-n), Line2, finishbar, Line2, 0, 1);
fib3= LineArray((finishbar-n), Line3, finishbar, Line3, 0, 1);
fib4= LineArray((finishbar-n), Line4, finishbar, Line4, 0, 1);
fib5= LineArray((finishbar-n), Line5, finishbar, Line5, 0, 1);
fib6= LineArray((finishbar-n), Line6, finishbar, Line6, 0, 1);
fib7= LineArray((finishbar-n), Line7, finishbar, Line7, 0, 1);

if (NOT ParamToggle("Automatic Fibonacci","On,Off"))
{
Plot(fib0,"", colorWhite);
Plot(fib100,"", colorRed);
Plot(fib1,"", colorGrey50);
Plot(fib2,"", colorGrey50);
Plot(fib3,"", colorOrange);
Plot(fib4,"", colorGrey50);
Plot(fib5,"", colorGrey50);
}
if (ParamToggle("Fib6","On,Off"))
{
Plot(fib6,"", colorDarkTeal);
}
if (ParamToggle("Fib7","On,Off"))
{
Plot(fib7,"", colorViolet);
 }
//Title = Name() + " -  FIB LEVELS ";
_SECTION_END();


_SECTION_BEGIN("Yancedolly Bands");
CY2 =80/2;//  Param("Medium Cycle Length?" ,80, 1 ,1000 ,1 )/2;
M2 = 1;// Param("Medium Cycle Multiplyer?" ,3, 0.01 ,10 ,1 );
UpY=EMA(C, CY2)+M2*ATR(CY2);
MdY=EMA(C, CY2);
DnY=EMA(C, CY2)-M2*ATR(CY2);


UpperBand4 =EMA( C, CY2) + ( 6.8540 * ATR(CY2));
UpperBand3 =EMA( C, CY2) + ( 4.2360 * ATR(CY2));
UpperBand2=EMA( C, CY2) +  ( 2.6180 * ATR(CY2));
UpperBand1=EMA( C, CY2) +  ( 1.6180 * ATR(CY2));

MidPoint=EMA(C, CY2);

LowerBand1=EMA( C, CY2) - ( 1.6180 * ATR(CY2));
LowerBand2=EMA( C, CY2) - ( 2.6180 * ATR(CY2));
LowerBand3=EMA( C, CY2) - ( 4.2360 * ATR(CY2));
LowerBand4=EMA( C, CY2) - ( 6.8540 * ATR(CY2));

Plot(UpperBand4,"",colorDarkTeal,1);
Plot(UpperBand3,"",colorDarkGrey,1);
Plot(UpperBand2,"",colorDarkRed,1);
Plot(UpperBand1,"",colorViolet,1);
Plot(MidPoint,"",colorDarkGreen,4);
Plot(LowerBand1,"",colorViolet,1);
Plot(LowerBand2,"",colorDarkRed,1);
Plot(LowerBand3,"",colorDarkGrey,1);
Plot(LowerBand4,"",colorDarkTeal,1);


Buy_LowerBand2 =C>LowerBand1 AND Ref(LowerBand1,-3)<LowerBand1;
Sell_LowerBand2 =C<LowerBand1;
//Sell=Sell_Williams;
//Sell=Sell_rsi;

Buy_LowerBand2 =ExRem(Buy_LowerBand2,Sell_LowerBand2); Sell_LowerBand2=ExRem(Sell_LowerBand2,Buy_LowerBand2);


//==============================================
//Type 14 --> SHR
//==============================================

SupResA = 20;//Param("Sup-Res A Period",20,0,100,1);
SupResB = 25;//Param("Sup-Res B Period",25,0,100,1);
nn=SupResB;
Hh=HHV(H,nn);
Ll=LLV(L,nn);


Buy_shr2 = Cross(H,Ref(Hh,-1));
Sell_shr2 = Cross (Ref(Ll,-1),L);
Buy_shr2 =ExRem(Buy_shr2 ,Sell_shr2 );Sell_shr2 =ExRem(Sell_shr2 ,Buy_shr2 );


Up5BarFractal = Ref(H,-2) < H AND Ref(H,-1) < H AND Ref(H,1) < H;// AND Ref(H,2) < H;
Down5BarFractal = Ref(L,-2) > L AND Ref(L,-1) > L AND Ref(L,1) > L;// AND Ref(L,2) > L;


Up = (Up5BarFractal );
Down = (Down5BarFractal);

Buy_Fractal = IIf(Down ,1,0);
Sell_Fractal = IIf(Up,1,0) ;
//Short = Sell;
//Cover = Buy;
BuyDT= (Buy_Fractal AND C<LowerBand1 AND IIf(Flip( Buy_shr2, Sell_shr2),1,0)==0) OR Buy_shr2 // OR (C<LowerBand2 AND IIf(Upper_x,1,0)==0 AND IIf(Flip( Buy_LowerBand2, Sell_LowerBand2),1,0)==0);
OR (Buy_Fractal  AND IsEmpty(LowerBand2)==1  );
SellDT=(Sell_Fractal AND C<LowerBand2 AND IIf(Flip( Buy_shr2, Sell_shr2),1,0)==0)
OR (IIf(Ref(Flip( Buy_shr2, Sell_shr2),-1),1,0)==1 AND Sell_shr2);

//==============================================
// END
//==============================================


BuyDT=ExRem(BuyDT,SellDT);SellDT=ExRem(SellDT,BuyDT);


Buy=BuyDT;
Sell=SellDT;
Buy=ExRem(Buy,Sell);Sell=ExRem(Sell,Buy);
Buy_fract1=Buy_fractal AND C<LowerBand2 AND IIf(Ref(Flip( BuyDT, SellDT),-1),1,0)==1 AND IIf(Flip( BuyDT, SellDT),1,0)==1;
Sell_fract1=(LLVBars(Low,2)==1 AND IIf(Ref(Flip( BuyDT, SellDT),-3),1,0)==1 AND IIf(Flip( BuyDT, SellDT),1,0)==1) OR SellDT;
Buy_fract1=ExRem(Buy_fract1,Sell_fract1);Sell_fract1=ExRem(Sell_fract1,Buy_fract1);
if (NOT ParamToggle("Smooth CCI Switch","On,Off"))
{

PlotShapes( BuyDT* shapeHollowUpTriangle, 11,0, L, -18);
PlotShapes( SellDT* shapeHollowDownTriangle, 11,0, H, -18);

PlotShapes( Buy_fract1 * shapeUpArrow, colorBlue,0, L, -30);
PlotShapes( Sell_fract1 * shapeDownArrow, colorBlue,0, H, -30);
}
PlotShapes( Buy_Shr2 * shapeHollowUpTriangle, colorDarkYellow,0, L, -22);
PlotShapes( Sell_Shr2 * shapeHollowDownTriangle, colorDarkYellow,0, H, -22);

_SECTION_END();
0 comments
Leave Comment
Please login here to leave a comment.