RAJA_SAR for Amibroker (AFL)
rsnerella almost 13 years ago Amibroker (AFL)
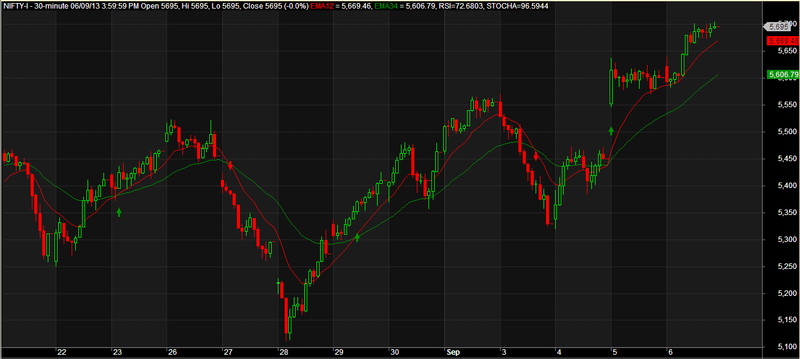
RAJA SAR RULES:
1. LONG RULE: CANDLE CLOSING BASIS 12 EMA SHOULD CROSSOVER ABOVE 34 EMA, RSI > 50, STOCHA > 50
2. SHORT RULE: CANDLE CLOSING BASIS 12 EMA SHOULD CROSSOVER BELOW 34 EMA, RSI < 50, STOCHA < 50
One can short either pullback towards 12/34 ema (based on certain rules) or can short in the next candle open after EMA crossover happens. Sell/Buy arrow comes to 12/34 EMA crossover. But do a RSI & STOCHA check before taking trade entry.
RSI RULES: NORMALLY RSI MOVES BETWEEN 20- TO 70 RANGE IN BEAR MARKET AND 50 TO 80+ IN BULL MARKET. SO TRAIL YOUR POSITIONS ACCORDINGLY.
STOCHA RULES: WHEN STOCHASTIC REACH TO 0, A BOUNCE IS EXPECTED SO TRAIL SHORTS CAREFULLY. WHEN STOCHASTIC REACH 100, THEN TRAIL LONGS CAREFULLY.
Time Frame: 30 minutes (Less whipsaws, more profit) verified for NIFTY.
You can do a back test (manual) and change the time frame for stock specific.
High volatile stocks requires higher time frame usage. Change accordingly.
Money management/intraday trade management is not covered here in this afl. Trader has to manage. In case if you have any questions, you can mail me rajapvt@gmail.com
Screenshots
Indicator / Formula
_SECTION_BEGIN("RAJASAR_4WISE_STOCK_TRADER");
/* RAJA SAR RULES:
1. LONG RULE: CANDLE CLOSING BASIS 12 EMA SHOULD CROSSOVER ABOVE 34 EMA, RSI > 50, STOCHA > 50
2. SHORT RULE: CANDLE CLOSING BASIS 12 EMA SHOULD CROSSOVER BELOW 34 EMA, RSI < 50, STOCHA < 50

One can short either pullback towards 12/34 ema (based on certain rules) or can short in the next candle open after EMA crossover happens. Sell/Buy arrow comes to 12/34 EMA crossover. But do a RSI & STOCHA check before taking trade entry.

RSI RULES: NORMALLY RSI MOVES BETWEEN 20- TO 70 RANGE IN BEAR MARKET AND 50 TO 80+ IN BULL MARKET. SO TRAIL YOUR POSITIONS ACCORDINGLY.

STOCHA RULES: WHEN STOCHASTIC REACH TO 0, A BOUNCE IS EXPECTED SO TRAIL SHORTS CAREFULLY. WHEN STOCHASTIC REACH 100, THEN TRAIL LONGS CAREFULLY.

Time Frame: 30 minutes (Less whipsaws, more profit) verified for NIFTY.
You can do a back test (manual) and change the time frame for stock specific.
High volatile stocks requires higher time frame usage. Change accordingly.

Money management/intraday trade management is not covered here in this afl. Trader has to manage. In case if you have any questions, you can mail me rajapvt@gmail.com
*/
SetChartOptions(0,chartShowArrows|chartShowDates);
SetChartOptions(2, chartWrapTitle );

_N(Title = StrFormat("{{NAME}} - {{INTERVAL}} {{DATE}} Open %g, Hi %g, Lo %g, Close %g (%.1f%%) {{VALUES}}", O, H, L, C, SelectedValue( ROC( C, 1 ) ) ));
Plot( C, "Close", ParamColor("Color", colorDefault ), styleNoTitle | ParamStyle("Style") | GetPriceStyle() );

Plot( EMA( C, 12 ), "EMA12", colorRed, styleLine );
Plot( EMA( C, 34 ), "EMA34", colorGreen, styleLine );

/*Sell = Short = Cross( EMA( Close, 34 ), EMA( Close, 12 )) AND (StochD(40 , 1, 1) < 50 ) AND (RSI(14) < 50);
Buy = Cover = Cross( EMA( Close, 12 ), EMA( Close, 34 )) AND (StochD(40 , 1, 1) > 50 ) AND (RSI(14) > 50);*/

Title = Title + ", RSI=" + RSI(14) + ", STOCHA=" + StochD(40 , 1, 1);

EmaSell = Cross( EMA( Close, 34 ), EMA( Close, 12 ));
EmaBuy = Cross( EMA( Close, 12 ), EMA( Close, 34 ));

AlertIf( EmaSell, "SOUND C:\\Windows\\Media\\ringout.wav", "Audio alert", 3 );
AlertIf( EmaBuy, "SOUND C:\\Windows\\Media\\ringin.wav", "Audio alert", 1 );

EmaBuy = ExRem( EmaBuy, EmaSell );
EmaSell = ExRem( EmaSell, EmaBuy );

shape = EmaBuy * shapeUpArrow + EmaSell * shapeDownArrow;
PlotShapes( shape, IIf( EmaBuy, colorGreen, colorRed ), 0, IIf( EmaBuy, Low-30, High+30));
_SECTION_END();
2 comments
Leave Comment
Please login here to leave a comment.
Hi,
Did check the AFL on Banknifty and Nifty Future on 11th Feb. 14 and found to be not happy as it hit the stop losses. May be the AFL have to be more sensitised. Thanks,
Vishnu Vandana
Vishnu Vandana, Have you traded only once? During non trending times and range day, no indicator gives you good profits. Follow all the signals and share the result.