Valid Supply-Demand zone for Amibroker (AFL)
casoni almost 13 years ago Amibroker (AFL)
Hello,
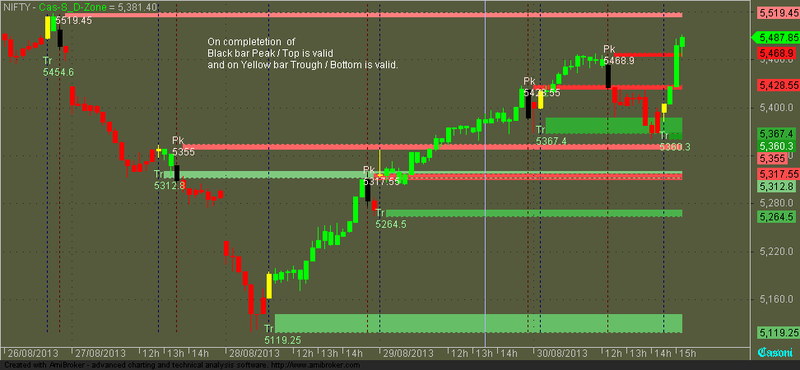
here i present valid supply-demand zones.
very basic idea.
as we all know..we need confirmation , for peak or bottom
to get fixed , i.e use wait till price rises/falls to certail percentage,
percentage to get peak/bottom valid.
here i have used valid peak/bottom..coded by tomasz, to plot zones,
zone [ cloud ] will plot only after peak/bottom is confirmed.
pls check and give your valuable feedback.
thank you
Screenshots
Indicator / Formula
Copy & Paste Friendly
SetChartOptions(0,chartShowArrows|chartShowDates);
bk=ParamColor( "Bk col",ColorRGB(85,90,60));
SetChartBkColor(bk);

amount = Param("Sensitivity", 0.5, 0.1, 2, 0.1 );

array = C ;
zz0 = Zig( array, amount );
zz1 = Ref( zz0, -1 );
zz2 = Ref( zz0, -2 );

tr = ValueWhen(zz0 > zz1 AND zz1 < zz2, zz1);
pk = ValueWhen(zz0 < zz1 AND zz1 > zz2, zz1);
PU = tr + 0.01 * abs(tr)*amount;
PD = pk - 0.01 * abs(pk)*amount;

ZZT = IIf( array >= PU AND zz0 > zz1, 1,
       IIf( array <= PD AND zz0 < zz1, -1, 0 ) );

ZZT = ValueWhen( ZZT != 0, ZZT );

Buy_Valid_=zzt>0;
Sell_Valid_=zzt<0;
Buy_Valid = ExRem(Buy_Valid_,Sell_Valid_);
Sell_Valid = ExRem(Sell_Valid_,Buy_Valid_);
Plot(Ref(Buy_valid,0),"",ColorRGB(0,0,100),styleHistogram|styleDashed|styleOwnScale|styleNoLabel,0,0,0,-1);
Plot(Ref(Sell_valid,0),"",ColorRGB(100,0,0),styleHistogram|styleDashed|styleOwnScale|styleNoLabel,0,0,0,-1);

Candlecol=IIf(BarsSince(Buy_Valid)<BarsSince(Sell_Valid) AND BarsSince(Buy_Valid)!=0,5,
          IIf(BarsSince(Buy_Valid)>BarsSince(Sell_Valid) AND BarsSince(Sell_Valid)!=0,4,1));
cc1=IIf(Buy_valid,colorYellow,IIf(Sell_valid,colorBlack,Candlecol));
SetBarFillColor(Cc1);
Plot(C,"Cas-S_D-Zone",Cc1,64,0,0,0,0);

pk=BarsSince(Buy_Valid)<BarsSince(Sell_Valid) ;//AND BarsSince(Buy_Valid)!=0;//Zz>Ref(zz,-1);
tr=BarsSince(Buy_Valid)>BarsSince(Sell_Valid) ;//AND BarsSince(Sell_Valid)!=0;//Zz<Ref(zz,-1);

Ll=LowestSince(sell_valid,L,1);
hH=HighestSince(Buy_Valid,H,1);
Llm=LowestSince(sell_valid,Min(O,C),1);
hHm=HighestSince(Buy_Valid,Max(O,C),1);

xx=Cum(1);
NoLines = Param("No of Lines",5,1,10,1);

Col2=ParamColor( "Res Color", colorRed );
Col1=ParamColor( "Sup Color", colorGreen );

for( i = 1; i < NoLines+1 ; i++ )
{
scol=ColorBlend(Col1,2,0.1*i);
rcol=ColorBlend(Col2,2,0.1*i);

px1 = LastValue(ValueWhen(Buy_valid,Cum(1),i)) ;
py1 = LastValue(ValueWhen(Buy_valid,Ll,i)) ;
pz1 = LineArray(px1, py1, (BarCount-1), py1);
Plot(pz1,"",scol,32);

tx1 = LastValue(ValueWhen(sell_valid,Cum(1),i)) ;
ty1 = LastValue(ValueWhen(sell_valid,Hh,i)) ;
tz1 = LineArray(tx1, ty1, (BarCount-1), ty1);
Plot(tz1,"",rcol,32);

px1m = LastValue(ValueWhen(Buy_valid,Cum(1),i)) ;
py1m = LastValue(ValueWhen(Buy_valid,Llm,i)) ;
pz1m = LineArray(px1m, py1m, (BarCount-1), py1m);
PlotOHLC(pz1,pz1,pz1m,pz1m,"",scol,styleCloud|styleNoLabel,0,0,0,-i-nolines);

tx1m = LastValue(ValueWhen(sell_valid,Cum(1),i)) ;
ty1m = LastValue(ValueWhen(sell_valid,Hhm,i)) ;
tz1m = LineArray(tx1m, ty1m, (BarCount-1), ty1m);
PlotOHLC(tz1,tz1,tz1m,tz1m,"",rcol,styleCloud|styleNoLabel,0,0,0,-i-nolines);
}

for( j = 0; j < BarCount; j++ )
{
if( Buy_valid [j])  PlotText( "Tr\n"+Ll[ j ], j, Ll[j], colorPaleGreen );
if( Sell_valid[j] ) PlotText( "Pk\n"+Hh[ j ], j, Hh[j], colorRose);
}
21 comments
Leave Comment
Please login here to leave a comment.
Looks good ..thanx you for sharing casoni !
Can u pls explain how to use it?
sir chart plain no signal message for scol= colorblend
Dear Casoni,
This is a cool AFl, but can you tell us how to use this afl like entry and exit?
Any set of rules to use this?
Thanks
exotic stuff. run tick bar repaly in ur amibroker to see how it works.great job casoni. thx a ton
Thank you nareshpriya , alok.
add below code for buy-sell-short-cover.
this are basic
you can add position when price is above last resistance or support
i.e more buy when price has crossed resistance
short more when price crosses support .
ps- above condition had not been added to buy-sell …. code
Thank you Casoni.
Great Stuff.
I have only to add:
As I understand the demand zone becomes valid only if it crosses previous supply zone and same with the supply zone.
This AFL is slightly different.
Where can I find the color coding of the candles and thier significance?
Thanks for the excellent AFL.
Saify
Thanks Casoni !!!
Thank’s Mr. Casoni, this AFL’v ability to guidance whenever loss my choice.
sir syntex error chart not working kindly help me
Hi casoni
Can you code mt4 code waddah attar explosion in amibroker,please!
MACD BASED great system
which so far not available in Amibroker,but available in MT4
WADDAH ATTAR EXPLOSION-Call it as WAE
LINK
http://codebase.mql4.com/1000
It is already there on tradestation.
-—————————————————————-how to add these following to macd histogram code?
Using these settings on 1 hr:
Sensitivity 150
Dead Zone 30
Explosion Power 15
Trend Power 31
-—————————————————-here is base code for macd histogram
you can try and add other lines as per waddah attar explosion
please try
thanks
ford
-——————————_SECTION_BEGIN(“MACD normalized”);
SetChartBkColor(64);
sma = Param(“short EMA periods”,20,1,21);
lma = Param (“long EMA periods”,40, 2, 2520);
tsp = Param (“MACD trigger signal periods”,9,1,21);
np = Param (“normalizing periods (1=none)”, 50,1, 2520);
x = Param (“use Open=1 High=2 Low=3 Close=4 Volume=5 P=6”,4,1,6);
x = IIf (x1,Open, IIf (x2,High, IIf (x3,Low, IIf (x5, Volume, IIf (x==6,C,C)))));
sh = EMA;
lon = EMA;
ratio = Min(sh,lon)/Max(sh,lon);
Mac = (IIf (sh>lon,2-ratio,ratio)-1)*100;
MacNorm = (Mac-LLV) /(HHV-LLV+.000001)*100;
MacNorm = IIf (np <2,Mac,MacNorm);
Trigger = EMA (MacNorm, tsp);
Hist = MacNorm-trigger;
Histcolor=IIf(Hist>0,colorGreen,IIf(-Hist>0,colorRed,colorGrey50));
dynamic_color = IIf( MAcNorm < trigger, colorRed, colorBrightGreen );
Plot(MAcNorm,“macd”,dynamic_Color,styleHistogram,styleThick);
Hello Ford7,
as far as i remember WADDAH ATTAR .. is based on combination of Bollinger band and Macd
sorry i am no good in converting mt4 codes. to convert those you need to have good knowledge of Loops
ask at traderji – Kelvin hand or trash can help
sir pls help
showing error 30 ,syntax error , scol= colorblend
kindly help
Even though zig looks in the future its a good afl to determine the demand supply zones ! Thanks ! If someone an code a multi timeframe version of the above code it will be great
Really useful
tnks for the afl, can u pl give the color coding of the candles ….
In trader who’s success rate is above 40% is considered good it apply on big institution also, and this indicator results are above 60% use this indicator along with EMA crossover for better results….
thanks author for this awesome afl if anyone able to make better than this my good wishes with him/her.
Hello Ford7,
Thanks for assisting every one not just here but in TJ as well.
I see (yeah after all these years) Trash had coded a few modified versions upto 1.5. But strangely all I get is a blank screen (Ami 5.6). Any insight would greatly help.
Cheers
KK
Word of caution , this indicator uses “Zig” check replay in amibroker and use.
Good Code
Thank you
I am wondering why everyone praising this indicator but the bitter truth is it’s heavily repainted. I used this one on EOD, trust me it’s disappearing like anything. Unfortunately, this can’t be used.