Visual BackTest V2 for Amibroker (AFL)
sethmo over 12 years ago Amibroker (AFL)
This is the updated version of my Visual Backtester.p. p.
Added a few new things: more stats and profits/losses on chart (so you can see what each trade made/lost). p. p.
As for the trade condition and trade management, I created those because I had a problem with prior systems overlapping trades. So the systemstate variable prevents overlapping (i.e. having a long and short trade open at the same time) – that’s just for me, use it if you find it useful, otherwise, you can delete the trade conditions and just directly edit Buy, Sell, Short, Cover.p. p.
How to use:p. p.
Define your entry rules under LongEntry1 and ShortEntry1. If you have multiple, then create LongEntry2 and ShortEntry2, etc. Then under LongEntry and “or LongEntry2”, etc. Same applies for the exits. If you don’t have any conditions, just enter 0 (zero).p. p.
Then under LongEntryPrice and all the other prices, replace O with your price.p. p.
Explanation of the Graphs:p. p.
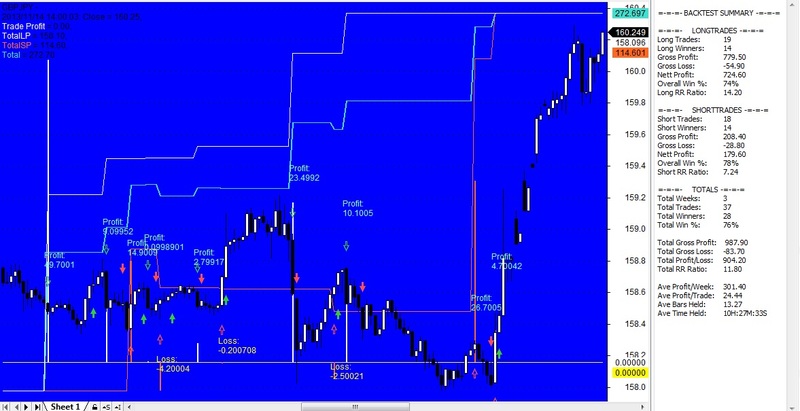
The TradeProfits graphs (the histogram) show the profit/loss made per trade. They are plotted about the 0 line, so anything under the 0 line is a loss. You can see at a glance your win/loss ratio.p. p.
The totals graphs show the cumulative profits/losses as and when a trade is closed. This gives you and idea of the effect of the trades on your total points/gained lost. Up is good, down is bad.p. p.
Enjoyp. p.
DISCLAIMER: Don’t trade this system! It’s just there as an example. I can’t be held responsible for any results my formula produces. As with anything, take your time to learn how to do something well and right before committing real money.
Screenshots
Indicator / Formula
//Visual BackTest for Amibroker
//Made by Sethmo (Ipeleng Molete)
//Date Made: 17 December 2013
//Feel free to use as you wish, please acknowledge the author

SetBarsRequired(-2,0);
SetChartOptions(0,chartShowArrows|chartShowDates);
_N(Title = StrFormat("{{NAME}} - {{INTERVAL}} {{DATE}} Open %g, Hi %g, Lo %g, Close %g (%.1f%%) {{VALUES}}", O, H, L, C, SelectedValue( ROC( C, 1 ) ) ));

//----------------------------------------------------------//
//	TRADE CONDITIONS
//----------------------------------------------------------//

LongEntry1 = Cross(EMA(C,5),EMA(C,10));
ShortEntry1 = Cross(EMA(C,10), EMA(C,5));

LongExit1 = RSI(14) < 50;
ShortExit1 = RSI(14) > 50;

LongEntry = LongEntry1;
ShortEntry = ShortEntry1;

LongExit = LongExit1;
ShortExit = ShortExit1;

newDay = Day() != Ref(Day(),-1);

LongEntryDate = ValueWhen(LongEntry, DateTime());
ShortEntryDate = ValueWhen(ShortEntry, DateTime());
LongExitDate = ValueWhen(LongExit, DateTime());
ShortExitDate = ValueWhen(ShortExit, DateTime());

Longtrue = Flip(Longentry, LongExit);
Shorttrue = Flip(Shortentry, Shortexit);

systemState = IIf(Shorttrue AND !Longtrue, 0, //in short trade
				IIf(Longtrue AND !Shorttrue, 1, //in long trade
				IIf(!Longtrue AND !Shorttrue, 2, 3)));//ready

LongEntry = LongEntry AND systemstate == 1;
ShortEntry = ShortEntry AND systemstate == 0;

//----------------------------------------------------------//
//	TRADE MANAGEMENT
//----------------------------------------------------------//

Buy = LongEntry AND systemstate == 1;
Sell = LongExit;
Short = ShortEntry AND systemstate == 0;
Cover = ShortExit;

Buy = IIf(Cover, Ref(Buy,-1), Buy);
Short = IIf(Sell, Ref(Short,-1), Short);

inlong = Flip(Buy, Sell);
inshort = Flip(Short, Cover);

realBuy = inlong AND !Ref(inlong, -1);
realSell = !inlong AND Ref(inlong, -1);
realShort = inshort AND !Ref(inshort,-1);
realCover = !inshort AND Ref(inshort,-1);

LongEntryPrice = ValueWhen(realBuy,O);
LongExitPrice = ValueWhen(realSell,O);
ShortEntryPrice = ValueWhen(realShort,O);
ShortExitPrice = ValueWhen(realCover,O);

LongEntryDate = ValueWhen(realBuy,DateTime());
LongExitDate = ValueWhen(realSell,DateTime());
ShortEntryDate = ValueWhen(realShort,DateTime());
ShortExitDate = ValueWhen(realCover,DateTime());

BuyPrice = LongEntryPrice;
SellPrice = LongExitPrice;
ShortPrice = ShortEntryPrice;
CoverPrice = ShortExitPrice;

EnableTextOutput(False);
tradetext = WriteIf(realBuy, "buy", WriteIf(realSell, "sell", WriteIf(realShort, "short", WriteIf(realCover, "cover", ""))));
EnableTextOutput(True);

//----------------------------------------------------------//
//	VISUAL BACKTESTING
//----------------------------------------------------------//

Tick_Size = IIf(TickSize != 0, TickSize, 1);

_N(DayText = WriteIf(DayOfWeek() == 0, "\nSunday",
			 WriteIf(DayOfWeek() == 1, "\nMonday",
			 WriteIf(DayOfWeek() == 2, "\nTuesday",
			 WriteIf(DayOfWeek() == 3, "\nWednesday",
			 WriteIf(DayOfWeek() == 4, "\nThursday",
			 WriteIf(DayOfWeek() == 5, "\nFriday", "\nSaturday")))))));

LongProfit = IIf(realSell,ValueWhen(realSell,(LongExitPrice - LongEntryPrice)/tick_size),0);
ShortProfit = IIf(realCover,ValueWhen(realCover, (ShortEntryPrice - ShortExitPrice)/tick_size),0);

Profit = IIf(realSell, LongProfit - (10*TickSize),
		  IIf(realCover, ShortProfit - (10*TickSize), 0));

TotalLP = Sum(LongProfit, Cum(1));
TotalSP = Sum(ShortProfit, Cum(1));
Total = TotalLP + TotalSP;

LongProfitColour = colorWhite;
ShortProfitColour = colorOrange;
TotalColour = colorTurquoise;

LongTrades = 0;
ShortTrades = 0;
LongWinners = 0;
ShortWinners = 0;

LongProfitSum = 0;
ShortProfitSum = 0;

LongLossSum = 0;
ShortLossSum = 0;

doW = DayOfWeek();
numWeeks = 0;

HoldingTimeBars = IIf(realSell, BarsSince(realBuy), IIf(realCover, BarsSince(realShort), 0));
LongHoldingTimeBarsSum = 0;
ShortHoldingTimeBarsSum = 0;

HoldingTime = IIf(realSell, DateTimeDiff(LongExitDate,LongEntryDate),
			    IIf(realCover, DateTimeDiff(ShortExitDate, ShortEntryDate), 0));

LongHoldingTimeSum = 0;
ShortHoldingTimeSum = 0;

for (i = 0; i < BarCount - 1; i++)
{
	if(realSell[i])
	{
		LongTrades++;
		LongHoldingTimeBarsSum += HoldingtimeBars[i];
		LongHoldingTimeSum += Holdingtime[i];
	}
	if(realCover[i])
	{
		ShortTrades++;
		ShortHoldingTimeBarsSum += HoldingtimeBars[i];
		ShortHoldingTimeSum += Holdingtime[i];
	}
	if(LongProfit[i] > 0)
	{
		LongWinners++;
		LongProfitSum += LongProfit[i];
	}
	if(ShortProfit[i] > 0)
	{
		ShortWinners++;
		ShortProfitSum += ShortProfit[i];
	}
	if(LongProfit[i] < 0)
	{
		LongLossSum += LongProfit[i];
	}
	if(ShortProfit[i] < 0)
	{
		ShortLossSum += ShortProfit[i];
	}
	if(doW[i] > dow[i+1])
	{
		numWeeks++;
	}
}

LongWinPerc = (LongWinners/LongTrades)*100;
ShortWinPerc = (ShortWinners/ShortTrades)*100;
TotalTrades = LongTrades + ShortTrades;
TotalWinners = LongWinners + ShortWinners;
TotalWinPerc = (TotalWinners/TotalTrades) * 100;

TotalGrossLong = LongProfitSum;///Tick_Size;
TotalGrossShort = ShortProfitSum;///Tick_Size;
TotalLongLoss = LongLossSum;///Tick_Size;
TotalShortLoss = ShortLossSum;///Tick_Size;

TotalGrossProfit = TotalGrossLong + TotalGrossShort;
TotalGrossLoss = TotalLongLoss + TotalShortLoss;

ProfitPerWeek = (LastValue(Total)/numWeeks);
TotalHoldingTimeBars = LongHoldingTimeBarsSum + ShortHoldingTimeBarsSum;
AveHoldingTimeBars = TotalHoldingTimeBars/TotalTrades;

TotalHoldingTime = LongHoldingTimeSum + ShortHoldingTimeSum;
AveHoldingTime = TotalHoldingTime/TotalTrades;

AHT_hours = int((AveHoldingTime / 60 / 60) % 24);
AHT_minutes = int((AveHoldingTime / 60) % 60);
AHT_seconds = int(AveHoldingTime % 60);

printf("\n=-=-=- BACKTEST SUMMARY -=-=-=");
printf("\n");
printf("\n=-=-=-\t LONGTRADES -=-=-=");
printf("\nLong Trades: \t" + WriteVal(LongTrades, 1.0));
printf("\nLong Winners: \t" + WriteVal(LongWinners, 1.0));
printf("\nGross Profit: \t" + WriteVal(TotalGrossLong, 1.2));
printf("\nGross Loss: \t" + WriteVal(TotalLongLoss, 1.2));
printf("\nNett Profit: \t" + WriteVal(LastValue(TotalLP), 1.2));
printf("\nOverall Win %%: \t" + WriteVal(LongWinPerc, 1.0) + "%%");
printf("\nLong RR Ratio: \t" + WriteVal(TotalGrossLong/IIf(TotalLongLoss != 0, -TotalLongLoss, 1), 1.2));
printf("\n");
printf("\n=-=-=-\t SHORTTRADES -=-=-=");
printf("\nShort Trades: \t" + WriteVal(ShortTrades, 1.0));
printf("\nShort Winners: \t" + WriteVal(ShortWinners, 1.0));
printf("\nGross Profit: \t" + WriteVal(TotalGrossShort, 1.2));
printf("\nGross Loss: \t" + WriteVal(TotalShortLoss, 1.2));
printf("\nNett Profit: \t" + WriteVal(LastValue(TotalSP), 1.2));
printf("\nOverall Win %%: \t" + WriteVal(ShortWinPerc, 1.0) + "%%");
printf("\nShort RR Ratio: \t" + WriteVal(TotalGrossShort/IIf(TotalShortLoss != 0, -TotalShortLoss, 1), 1.2));
printf("\n");

printf("\n=-=-=-\t TOTALS -=-=-=");
printf("\nTotal Weeks: \t" + WriteVal(numWeeks,1.0));
printf("\nTotal Trades: \t" + WriteVal(TotalTrades, 1.0));
printf("\nTotal Winners: \t" + WriteVal(TotalWinners, 1.0));
printf("\nTotal Win %%: \t" + WriteVal(TotalWinPerc, 1.0) + "%%");
printf("\n");
printf("\nTotal Gross Profit: \t " + WriteVal(TotalGrossProfit, 1.2));
printf("\nTotal Gross Loss: \t" + WriteVal(TotalGrossLoss, 1.2));
printf("\nTotal Profit/Loss: \t" + WriteVal(LastValue(Total), 1.2));
printf("\nTotal RR Ratio: \t" + WriteVal(TotalGrossProfit/IIf(TotalGrossLoss != 0, -TotalGrossLoss, 1), 1.2));
printf("\n");
printf("\nAve Profit/Week: \t" + WriteVal(ProfitPerWeek, 1.2));
printf("\nAve Profit/Trade: \t" + WriteVal((LastValue(Total)/TotalTrades), 1.2));
printf("\nAve Bars Held: \t" + WriteVal(AveHoldingTimeBars, 1.2));
printf("\nAve Time Held: \t" + WriteVal(AHT_Hours, 1.0) + "H:" + WriteVal(AHT_Minutes, 1.0) + "M:" + WriteVal(AHT_Seconds, 1.0) + "S");

//----------------------------------------------------------//
//	PLOTTING
//----------------------------------------------------------//

SetChartBkGradientFill(  colorBlue , colorBlue);

ParamStr("=== PLOTTING ===","");

Plot( C, "\n" + Date() + ": Close", colorBlack, styleCandle );

if (ParamToggle("Show TRADE PROFITS?", "No|Yes", 0))
{

dist = 2 * ATR(10);

	for( i = 0; i < BarCount; i++ )
	{
		if( Profit[i] != 0 )
		{
			if (Profit[i] > 0)
			{
			PlotText( "Profit:\n" + Profit[ i ], i, H[ i ]+dist[i], colorAqua );
			}
			else
			{
		 	PlotText( "Loss:\n" + Profit[ i ], i, L[ i ]-dist[i], colorYellow );
			}
		}

	}

	Plot(Profit, "\nTrade Profit", IIf(LongProfit, LongProfitColour, IIf(ShortProfit, ShortProfitColour, colorWhite)), styleThick | styleHistogram | styleLeftAxisScale );
	Plot(0, "\n0", colorYellow, styleThick | styleLeftAxisScale | styleNoTitle);
}

if (ParamToggle("Show TOTALS?", "No | Yes", 0))
{
	Plot(totalLP, "\nTotalLP", LongProfitColour, styleLine | styleOwnScale);
	Plot(totalSP, "\nTotalSP", ShortProfitColour, styleLine | styleOwnScale);
	Plot(total, "\nTotal", TotalColour, styleThick | styleLine | styleOwnScale);
}

if (ParamToggle("Show REAL TRADES?", "No|Yes", 0))
{
	PlotShapes( realBuy * shapeUpArrow, colorLime, 0, L, -30);
	PlotShapes( realSell * shapeHollowDownArrow, colorLime, 0, H, -30);
	PlotShapes( realShort * shapeDownArrow, ColorBlend(colorRed, colorWhite, 0.3), 0, H, -30);
	PlotShapes( realCover * shapeHollowUpArrow, ColorBlend(colorRed, colorWhite, 0.3), 0, L, -30);
}
8 comments
Leave Comment
Please login here to leave a comment.
LongEntryPrice = ValueWhen(realBuy,O);
LongExitPrice = ValueWhen(realSell,O);
ShortEntryPrice = ValueWhen(realShort,O);
ShortExitPrice = ValueWhen(realCover,O);
Change to :-
LongEntryPrice = ValueWhen(realBuy,C);
LongExitPrice = ValueWhen(realSell,C);
ShortEntryPrice = ValueWhen(realShort,C);
ShortExitPrice = ValueWhen(realCover,C);
Now see the result…
Thanks, Ocil. My trading system that I was using when developing the backtester was built on trading on the open. Guess I forgot to change that.
Hi Sethmo this is the Very Good Visual Back-testing Afl
and Looks Nice
i Have Some Doubts
1.i want to check the Profit and Loss for Selected dates how can it be done
2. i want to check the last 10 trades as visual with Profit and loss
So kindly Provide the details with code thank you
To Karthikayan
The trade dates are stored in:
LongEntryDate, LongExitDate, ShortEntryDate and ShortExitDate. You can add them to the graph using the PlotText function.
To solve both your problems, you may want to look at the fputs function (there’s an example in the Help section of Amibroker and you can probably find examples online). This will allow you to create a .csv file where you can do your analysis.
Thanks.
sethmo
Hi sethmo i can see the plotting of trades
but i need for specifice tates in the intepration window for the last 10 trades with profit and loss
i dont want in excel
by backtesting we can import in excel but the advatfae of seeing specic dates in interpretation window will be fine for all things by visual
hope you can do this
becuse u already done better things in this afl so u can do that also iam doing auto trade so hope its helpful to choose the right one by vieing selected stock in interpretaion window
To Karthikayan
I hope you can appreciate that I spent a few hours in my spare time coding this template and I have provided it free for use. I am willing to provide support for code already there, but writing custom code for free is where I draw the line. If I set the precedence of writing the code for you, I must then humour every request for custom code and test and support that code (for free), which means I should do what I do for a living (coding) – for free. I think you can see my dilemma. With that said, I can give you some ideas, however, implementation is up to you.
You can use a loop to do that, perhaps copy and modify the loop in the Plotting section under “Show Trade Profits” to count backwards. Maybe use LastValue of Profit to get the last trade trade’s BarIndex and loop back from there.
Here’s a tutorial on looping in Amibroker that I found very useful and I hope you do too.
http://www.amibrokerforum.com/index.php?topic=50.0
Good luck.
Sethmo
Sethmo,
I appreciate your work & thanks for the same. I also applaud your being kind in helping the traders to back test their strategy & data. BTW, is there any possibility to export the data in the excel form giving the success trades & losing trades with a ROI..(Return on Investment).. Thanks & Regards, Sirisha
Sethmo,
I’m also not getting the summary.. Appreciate if you can let me know the procedure to get summary.. Thanks & Regards, Sirisha