3-13-Ema-ADX for Amibroker (AFL)
abhig10 over 12 years ago Amibroker (AFL)
//
// This is just a development of a system I found here: http://debarghyamukherjee.webs.com/3-13-39-ema-technique
// into an AFL.
//
// Also I implemented a simple technique for trailing stop loss borrowed from
// http://www.wisestocktrader.com/indicators/3907-profit-trading-system-with-target-and-stoploss
//
// For more details see the remarks below.
//
//———————————————————————————————————————
//
// Application: Drag & Drop.
//
// This system uses Stochastic to define the trend and 3/13ema for entry values.
// Exit is done on the basis of trailing SL. Stay in trade until SL is hit.
// ADX is used to see if there is enough momentum.
// Best used on a 15min or greater time frame.
// The best use is in trending stocks.
// Advice: Do not carry an over-night position without a proper hedge.
//
// Written by: Abhishek Gupta
//
Screenshots
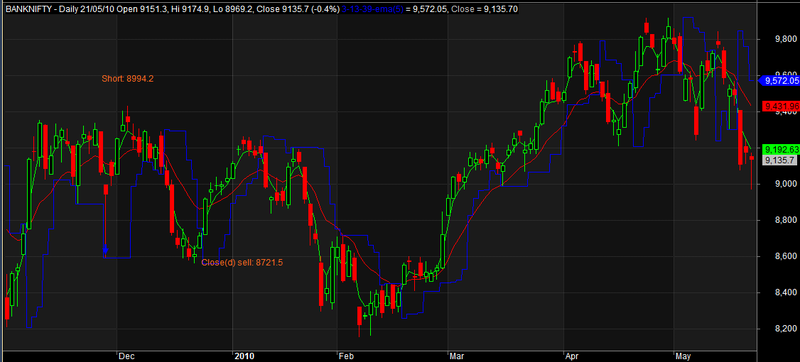
Indicator / Formula
//------------------------------------------------------------------------------
//
//  Formula Name:    3-13-39-ema
//  Author/Uploader: Abhishek Gupta
//  E-mail:          abhishekgupta10d12@gmail.com
//  Date/Time Added: 2013-12-17
//  Origin:
//  Keywords:
//  Level:           beginner/medium
//  Flags:           indicator
//
//------------------------------------------------------------------------------
//
//	 This is just a development of a system I found here: http://debarghyamukherjee.webs.com/3-13-39-ema-technique
//	 into an AFL.
//
//	 Also I implemented a simple technique for trailing stop loss borrowed from
//	 http://www.wisestocktrader.com/indicators/3907-profit-trading-system-with-target-and-stoploss
//
//  For more details see the remarks below.
//
//------------------------------------------------------------------------------
//
//	Application: Drag & Drop.
//
//	This system uses Stochastic to define the trend and 3/13ema for entry values.
//	Exit is done on the basis of trailing SL. Stay in trade until SL is hit.
//	ADX is used to see if there is enough momentum.
//	Best used on a 15min or greater time frame.
//	The best use is in trending stocks.
//	Advice: Do not carry an over-night position without a proper hedge.
//
//	Written by: Abhishek Gupta

// Default intialization

sig		= "";
atVal	= 0;
sold	= 0;
bought	= 0;
bar		= 0;

// Trailing stop loss
no		= Param( "Swing", 5, 1, 55 );
res		= HHV(H,no);
sup		= LLV(L,no);
tsl		= IIf(ValueWhen(IIf(C>Ref(res,-1),1,IIf(C<Ref(sup,-1),-1,0))!=0,IIf(C>Ref(res,-1),1,IIf(C<Ref(sup,-1),-1,0)),1)==1,sup,res);
Plot(tsl, _DEFAULT_NAME(), colorBlue, styleStaircase);
// End trailing stop loss

// Stochastic
periods	= Param( "Periods", 15, 1, 200, 1 );
Ksmooth	= Param( "%K avg", 3, 1, 200, 1 );
Dsmooth	= Param( "%D avg", 3, 1, 200, 1 );
stocK		= StochK(periods, Ksmooth);
stocD		= StochD(periods, Ksmooth, Dsmooth);
// End Stochastic

// ADX - Trend momentum
ADX14 = ADX(14);
// End

// Buy, Sell, Short and Cover conditions
Buy = Cross( EMA( Close, 3 ), EMA( Close, 13 ))
	//AND tsl<Low
	AND stocK > Ref(stocK, -1)
	AND ADX14 > Ref(ADX14, -1) AND ADX14>15;

Sell = Cross( tsl, Low);

Short = Cross( EMA( Close, 13 ), EMA( Close, 3 ))
	//AND tsl>High
	AND stocK < Ref(stocK, -1)
	AND ADX14 > Ref(ADX14, -1) AND ADX14>15;

Cover = Cross( High, tsl);
// End Conditions

// Toggle candle visibility
if (ParamToggle("Candles", "Show|Hide",0)){
_SECTION_BEGIN("Price");
SetChartOptions(0,chartShowArrows|chartShowDates);
_N(Title = StrFormat("{{NAME}} - {{INTERVAL}} {{DATE}} Open %g, Hi %g, Lo %g, Close %g (%.1f%%) {{VALUES}}", O, H, L, C, SelectedValue( ROC( C, 1 ) ) ));
Plot( C, "Close", ParamColor("Color", colorDefault ), styleCandle | styleThick );
_SECTION_END();
}
// End toggle

// Plotting moving averages
Plot(EMA(Close,3),"",colorBrightGreen, styleLine, styleThick);
Plot(EMA(Close,13),"",colorRed, styleLine, styleThick);
// End plotting

// Plot buy sell signals
dist = 0.8*ATR(1); //0.8
dist1 = 1.2*ATR(1); //1.2
for( i = 0; i < BarCount; i++ ) {
	if( Buy[i] && sold==0 ) {
		PlotText( "Buy: " + O[ i ], i, L[ i ]-dist[i], colorLime);
		sig	= "Buy";
		atVal	= O[i];
		bought	= 1;
		bar	= i;
	} else if( Buy[i] ) {
		PlotText( "Close short and Buy: " + O[ i ], i, L[ i ]-dist[i], colorLime);
		sig	= "Close short and Buy";
		atVal	= O[i];
		bought	= 1;
		bar	= i;
		sold	= sold-1;
	} else if( Short[i] && bought==0 ) {
		PlotText( "Short: " + O[ i ], i, H[ i ]+dist1[i], colorOrange);
		sig	= "Short";
		atVal	= O[i];
		sold	= 1;
		bar	= i;
	} else if( Short[i]) {
		PlotText( "Close buy and Short: " + O[ i ], i, H[ i ]+dist1[i], colorOrange);
		sig	= "Close buy and Short";
		atVal	= O[i];
		sold	= 1;
		bar	= i;
		bought	= bought-1;
	} else if( Sell[i] && bought==1) {
		PlotText( "Close(d) buy: " + O[ i ], i, H[ i ]+dist1[i], colorOrange);
		sig		= "Close(d) buy";
		atVal	= O[i];
		bought	= bought-1;
	} else if( Cover[i] && sold==1) {
		PlotText( "Close(d) sell: " + O[ i ], i, L[ i ]-dist[i], colorOrange);
		sig		= "Close(d) sell";
		atVal	= O[i];
		sold	= sold-1;
 	}
}

printf("Signal came " + (BarCount-bar) + " bars ago");
PlotShapes(Buy*shapeUpArrow,colorGreen,0);
PlotShapes(Short*shapeDownArrow,colorBlue,0);
printf("\n" + sig + " at: " + atVal);
// End plot

// Write interpretation
if (sig == "Buy" || sig == "Close short and Buy") {
	printf("\nTrailing SL: " + tsl);
	printf("\n\nPossiblities ");
	printf("\nMax P/L: " + (H-atVal));
	printf("\nMin P/L: " + (L-atVal));
} else if (sig== "Short" || sig== "Close buy and Short") {
	printf("\nTrailing SL: " + tsl);
	printf("\n\nPossiblities ");
	printf("\nMax P/L: " + (atVal-L));
	printf("\nMin P/L: " + (atVal-H));
}
// End interpretation

// Write Messages
printf("\n\nLook for trending markets bascially on a 15min or higher time frame.");
printf("\n\nLet the profits run.");
printf("\n\nDo not carry an over-night position without a proper hedge.");
// End messages
2 comments
Leave Comment
Please login here to leave a comment.
Nice Calls !!
Updated http://www.wisestocktrader.com/indicators/4160-3-13-ema-adx-1-1