SARVANI CLOUD for Amibroker (AFL)
chatpurpose about 12 years ago Amibroker (AFL)
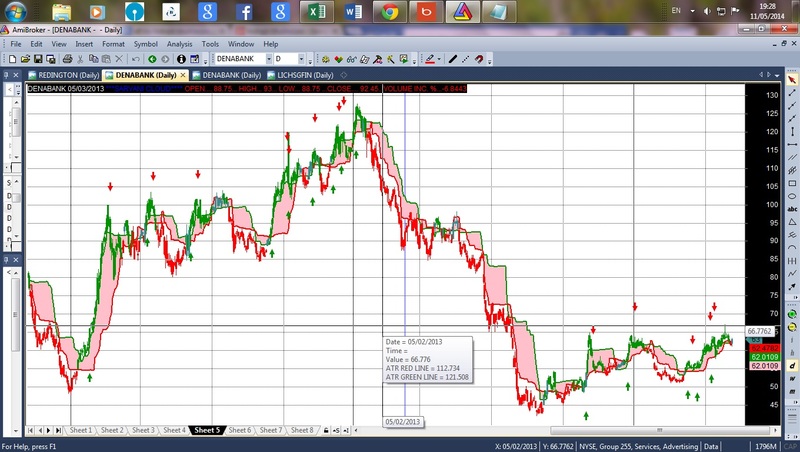
Hi..this is my first afl code on cloud type charts.
red line on top , green line down…
price rises and hits red and crosses red.
dont buy, wait for green line to cross red, before buy.
green line on top, red line down.
price rises and crosses both lines.
buy.
price in the cloud……wait
red line on top, green line down.
prices falls down..a sell
green line on top, red line down.
price falls down the red line. sell.
look at the screen shot.* no buy signals during down trend.
our first concern is not to lose, gain is only secondary. isnt it ?*
YOU CAN ALSO CHECK WITH ANY OTHER SYMBOL.
back test results ok. check with your data.
default parameters work perfect.
the afl code is BASED ON EOD DATA. HOWEVER, I STRONGLY BELIEVE THAT
IT SHOULD WORK FOR INTRADAY ALSO.
PLEASE RATE IT IF YOU LIKE IT.
Screenshots
Indicator / Formula
AP=Param("LLV,HHV PERIOD",21,6,40,1);
ATRP=Param("ATR PERIOD",21,6,40,1);

A=LLV(C,AP);
B=HHV(C,AP);
D=A+2*ATR(ATRP);
E=B-ATR(ATRP);
F=IIf(O>Ref(D,-1),1,0);
G=IIf(C<Ref(E,-1),-1,0);
PlotOHLC(O,H,L,C,"",IIf(F==1 AND MFI(14)>50,colorGreen,IIf(G==-1,colorRed,colorTeal)),styleCandle);
PI=(H+L+C)/3;
Plot(D,"ATR RED LINE",colorRed,styleThick);
Plot(E,"ATR GREEN LINE",colorGreen,styleThick);
PlotOHLC(D,D,E,E,"",colorPink,styleCloud);

I=IIf(Cross(PI,E),1,0);
J=IIf(PI<Ref(E,-1),-1,0);
Buy=C>E  AND E>D AND MACD()>Signal() AND ADX()>Ref(EMA(ADX(),3),-1) AND PDI()>Ref(PDI(),-1);

Sell=HighestSinceBars(MACD()>Ref(MACD(),-1),C,Nth=1);


Buy=ExRem(Buy,Sell);
Sell=ExRem(Sell,Buy);
PlotShapes(Buy*shapeUpArrow,colorGreen,0,yposition=L,Offset=-50);
PlotShapes(Sell*shapeDownArrow,colorRed,0,yposition=H,Offset=-50);
Title = Name() + " " + Date()+" " + EncodeColor( colorBlue ) +"***SARVANI CLOUD****" +EncodeColor( colorRed )
+ " OPEN.... " + O + "... HIGH... " + H + "... LOW... " + L + " ...CLOSE.... "+ C + "...VOLUME INC. %..." + ((V-EMA(V,7))/EMA(V,7))*100 + "\n";
1 comments
Leave Comment
Please login here to leave a comment.
It’s nice , Thanks.