Stock Portfolio Organizer
The ultimate porfolio management solution.
Shares, Margin, CFD's, Futures and Forex
EOD and Realtime
Dividends and Trust Distributions
And Much More ....
WiseTrader Toolbox
#1 Selling Amibroker Plugin featuring:
Advanced Adaptive Indicators
Advanced Pattern Exploration
Neural Networks
And Much More ....
Price Bollinger Band & SMA for Amibroker (AFL)
Rating:
3 / 5 (Votes 3)
Tags:
trading system, amibroker
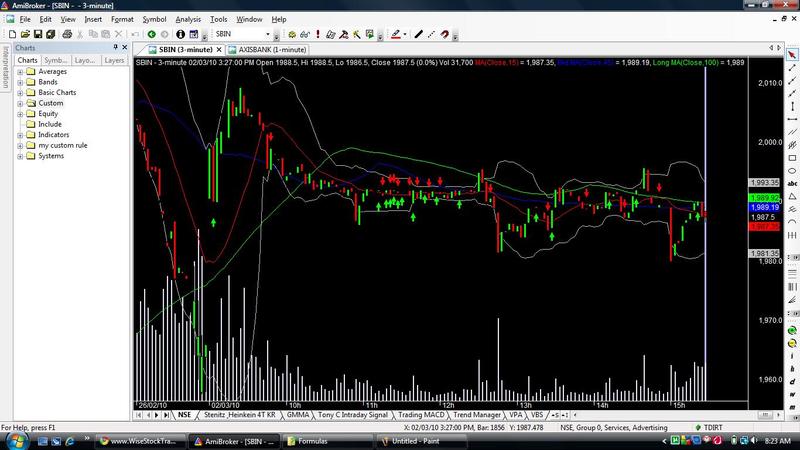
This Price indicator gives buy and sell indicator, which has bolliger band and sma of 15,45,100. I just added a buy and sell signal for this indicator at the end of the indicator formula.
Members let me know if it is ok.
Screen shot is attached. Time frame can be changed. The current timeframe is of 3 min. 7,10 and 15 Mins give clear pics.
Screenshots
Similar Indicators / Formulas
EMA crossover
Submitted
by Ketan-0 over 15 years ago
Kase Peak Osc. V2 batu
Submitted
by batu1453 almost 12 years ago
Kase CD V2batu
Submitted
by batu1453 almost 12 years ago
Ichimoku
Submitted
by prashantrdx almost 12 years ago
Adaptive Price Zone (APZ)
Submitted
by AndrewThomas over 15 years ago
LANDIS Modified
Submitted
by isfandi over 15 years ago
Indicator / Formula
Copy & Paste Friendly
_SECTION_BEGIN("Price");
SetChartOptions(0,chartShowArrows|chartShowDates);
_N(Title = StrFormat("{{NAME}} - {{INTERVAL}} {{DATE}} Open %g, Hi %g, Lo %g, Close %g (%.1f%%) Vol " +WriteVal( V, 1.0 ) +" {{VALUES}}", O, H, L, C, SelectedValue( ROC( C, 1 )) ));
Plot( C, "Close", ParamColor("Color", colorBlack ), styleNoTitle | ParamStyle("Style") | GetPriceStyle() );
if( ParamToggle("Tooltip shows", "All Values|Only Prices" ) )
{
 ToolTip=StrFormat("Open: %g\nHigh:  %g\nLow:   %g\nClose:  %g (%.1f%%)\nVolume: "+NumToStr( V, 1 ), O, H, L, C, SelectedValue( ROC( C, 1 )));
}
_SECTION_END();

_SECTION_BEGIN("MA");
P = ParamField("Price field",-1);
Periods = Param("Periods", 15, 2, 200, 1 );
Plot( MA( P, Periods ), _DEFAULT_NAME(), ParamColor( "Color", colorCycle ), ParamStyle("Style") | styleNoRescale );
_SECTION_END();

_SECTION_BEGIN("Mid MA");
P = ParamField("Price field",-1);
Periods = Param("Periods", 45, 2, 300, 1 );
Plot( MA( P, Periods ), _DEFAULT_NAME(), ParamColor( "Color", colorCycle ), ParamStyle("Style") | styleNoRescale );
_SECTION_END();

_SECTION_BEGIN("Long MA");
P = ParamField("Price field",-1);
Periods = Param("Periods", 100, 2, 400, 1 );
Plot( MA( P, Periods ), _DEFAULT_NAME(), ParamColor( "Color", colorCycle ), ParamStyle("Style") | styleNoRescale );
_SECTION_END();

_SECTION_BEGIN("BBands");
P = ParamField("Price field",-1);
Periods = Param("Periods", 15, 2, 300, 1 );
Width = Param("Width", 2, 0, 10, 0.05 );
Color = ParamColor("Color", colorLightGrey );
Style = ParamStyle("Style") | styleNoRescale | styleNoRescale;
Plot( BBandTop( P, Periods, Width ), "BBTop" + _PARAM_VALUES(), Color, Style );
Plot( BBandBot( P, Periods, Width ), "BBBot" + _PARAM_VALUES(), Color, Style );
_SECTION_END();

_SECTION_BEGIN("Volume");
Plot( Volume, _DEFAULT_NAME(), ParamColor("Color", colorLavender ), styleNoTitle | ParamStyle( "Style", styleHistogram | styleOwnScale | styleThick | styleNoLabel, maskHistogram  ), 2 );
_SECTION_END();

_SECTION_BEGIN("Price Interpretation");
movshort = ParamField("Short Time MA", 8 );
movmed = ParamField("Mid Time MA", 9 );
movlong = ParamField("Long Time MA", 10 );
btop = ParamField("BBTop", 11 );
bbot = ParamField("BBBottom", 12 );
if( Status("action") == actionCommentary )
{
width = btop - bbot;
lslop = LinRegSlope( C, 30 ) + 100;
lslo = LLV( lslop, 90 );
lshi = HHV( lslop, 90 );
lswidth = lshi - lslo;
trend = 100*( lslop - lslo )/lswidth;

mawidth = MA( width, 100 );
relwidth = 100*(width - mawidth)/mawidth;

_N( tname = Name()+"("+FullName()+")" );

printf("Price and moving averages:\n");
printf( tname + " has closed " + WriteIf( C > movshort, "above" , "below" ) + " its Short time moving average. ");

printf("\nShort time moving average is currently " + WriteIf( movshort > movmed, "above", "below") + " mid-time, AND " + WriteIf( movshort > movlong, "above", "below" ) + " long time moving averages.");

printf("\nThe relationship between price and moving averages is: "+
WriteIf( C > movshort AND movshort > movmed, "bullish",
WriteIf( C < movshort AND movshort < movmed, "bearish", "neutral" ) ) + " in short-term, and "+
WriteIf( movshort > movmed AND movmed > movlong , "bullish",
WriteIf( movshort < movmed AND movmed < movlong, "bearish", "neutral" ) ) + " in mid-long term. ");

printf("\n\nBollinger Bands:\n");
printf(tname+ " has closed " +
WriteIf( C < bbot, "below the lower band by " +
WriteVal( 100 *( bbot-C )/ width, 1.1 ) + "%%. " +
WriteIf( trend < 30, " This combined with the steep downtrend can suggest that the downward trend in prices has a good chance of continuing.  However, a short-term pull-back inside the bands is likely.",
WriteIf( trend > 30 AND trend < 70, "Although prices have broken the lower band and a downside breakout is possible, the most likely scenario for "+tname+" is to continue within current trading range.", "" ) ), "" ) +

WriteIf( C > btop, "above the upper band by " +
WriteVal( 100 *( C- btop )/ width, 1.1 ) + "%%. " +
WriteIf( trend > 70, " This combined with the steep uptrend suggests that the upward trend in prices has a good chance of continuing.  However, a short-term pull-back inside the bands is likely.",
WriteIf( trend > 30 AND trend < 70, "Although prices have broken the upper band and a upside breakout is possible, the most likely scenario for "+tname+" is to continue within current trading range.", "" ) ), "" ) +

WriteIf( C < btop AND ( ( btop - C ) / width ) < 0.5,
"below upper band by " +
WriteVal( 100 *( btop - C )/ width, 1.1 ) + "%%. ",
WriteIf( C < btop AND C > bbot , "above bottom band by " +
WriteVal( 100 *( C - bbot )/ width, 1.1 ) + "%%. ", "" ) ));

printf("\n"+
WriteIf( ( trend > 30 AND trend < 70 AND ( C > btop OR C < bbot ) ) AND abs(relwidth) > 40,
		 "This picture becomes somewhat unclear due to the fact that Bollinger Bands are  currently",
		 "Bollinger Bands are " )+
WriteVal( abs( relwidth ), 1.1 ) + "%% " +
WriteIf( relwidth > 0, "wider" , "narrower" ) +
" than normal.");

printf("\n");

printf(
WriteIf( abs( relwidth ) < 40, "The current width of the bands (alone) does not suggest anything conclusive about the future volatility or movement of prices.","")+
WriteIf( relwidth < -40, "The narrow width of the bands suggests low volatility as compared to " + tname + "'s normal range.  Therefore, the probability of volatility increasing with a sharp price move has increased for the near-term. "+
"The bands have been in this narrow range for " + WriteVal(BarsSince(Cross(-40,relwidth)),1.0) + " bars. The probability of a significant price move increases the longer the bands remain in this narrow range." ,"")+
WriteIf( relwidth > 40, "The large width of the bands suggest high volatility as compared to " + tname + "'s normal range.  Therefore, the probability of volatility decreasing and prices entering (or remaining in) a trading range has increased for the near-term. "+
"The bands have been in this wide range for  " + WriteVal(BarsSince(Cross(relwidth,40)),1.0) + " bars.The probability of prices consolidating into a less volatile trading range increases the longer the bands remain in this wide range." ,""));

printf("\n\nThis commentary is not a recommendation to buy or sell. Use at your own risk.");
}
_SECTION_END();

Buy = 	EMA(  Close , 5 ) > MA(  Close , 15 );

Sell = 	EMA(  Close , 12 ) > EMA(  Close , 5 );

Short = 0;

Cover = 0;


//remove excess Signals

Buy = ExRem(Buy,Sell);
Sell = ExRem(Sell,Buy);

PlotShapes(IIf(Buy,shapeUpArrow,shapeNone),colorBrightGreen,0,L,-15);
PlotShapes(IIf(Sell,shapeDownArrow,shapeNone),colorRed,0,H,-15);
0 comments
Leave Comment
Please login here to leave a comment.
Back