Zig Zag with valid entry and exit points for Amibroker (AFL)
mada8181 over 16 years ago Amibroker (AFL)
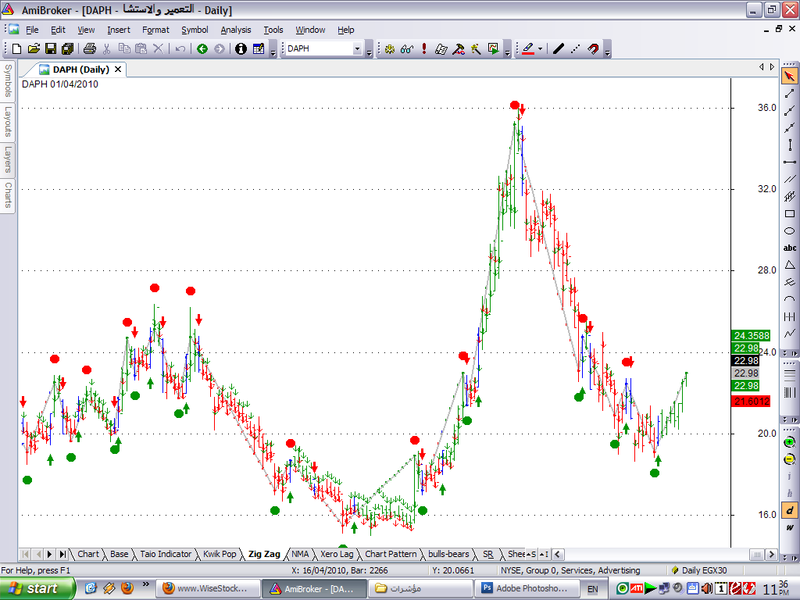
Simple but Efficient
Screenshots
Indicator / Formula
Copy & Paste Friendly
_SECTION_BEGIN("zig zag indicator with valid entry and exit points");
//z_ZigZagValid
// ******** CHARTING
PercentChange = 6;
mystartbar = SelectedValue(BarIndex());  // FOR GRAPHING

mystartbardate = LastValue(ValueWhen(mystartbar == BarIndex(), DateNum(),1));

InitialValue = LastValue(ValueWhen(mystartbardate == DateNum(), C , 1 ) ) ;
Temp1 = IIf(BarIndex() >= mystartbar, InitialValue, Null) ;
Plot(Temp1, " ", colorBlack,styleLine);
Plot((1+(LastValue(PercentChange)/100))*(Temp1), " ", colorGreen, styleLine) ;
Plot((1-(LastValue(PercentChange)/100))*(Temp1), " ", colorRed, styleLine) ;

ZZ = Zig(C,LastValue(PercentChange)) ;
PivotLow = Ref(IIf(Ref(ROC(ZZ,1),-1) < 0 AND ROC(ZZ,1) > 0, 1, Null),1);
PivotHigh = Ref(IIf(Ref(ROC(ZZ,1),-1) > 0 AND ROC(ZZ,1) < 0, 1, Null),1);

PlotShapes( shapeCircle*PivotLow, colorGreen,0, L, -20) ;
PlotShapes( shapeCircle*PivotHigh,colorRed,0,H, 20) ;

Buy_Valid = IIf(C>(1+(LastValue(PercentChange)/100))*(ValueWhen(PivotLow, C,
1))
AND ROC(ZZ,1) > 0,1,0);
Sell_Valid = IIf(C<(1-(LastValue(PercentChange)/100))*(ValueWhen(PivotHigh, C,
1))
AND ROC(ZZ,1) < 0,1,0);

Buy_Valid = ExRem(Buy_Valid,Sell_Valid);
Sell_Valid = ExRem(Sell_Valid,Buy_Valid);

PlotShapes( shapeUpArrow*Buy_Valid, colorGreen,0, L, -20);
PlotShapes( shapeDownArrow*Sell_Valid, colorRed,0,H, -20) ;

BarColors =
IIf(BarsSince(Buy_Valid) < BarsSince(Sell_Valid)
AND BarsSince(Buy_Valid)!=0, colorGreen,
IIf(BarsSince(Sell_Valid) < BarsSince(Buy_Valid)
AND BarsSince(Sell_Valid)!=0,  colorRed, colorBlue));

Plot(C, " ", BarColors,  styleBar ) ;
Plot(ZZ," ", colorLightGrey,styleLine|styleThick);
Plot(ZZ," ", BarColors,styleDots|styleNoLine);

Title = Name() + " " + Date() + WriteIf(PivotLow, " Up Pivot
","")+WriteIf(PivotHigh," Down Pivot ","")+ WriteIf(Buy_Valid, " Buy Point ",
"") + WriteIf(Sell_Valid, " Sell Point ", "") ;
_SECTION_END();
4 comments
Leave Comment
Please login here to leave a comment.
chart shows something different.
ramshirsath no the chart is fine that’s also what i get.
right sir formula is applicable on daily basis thanks..
not working