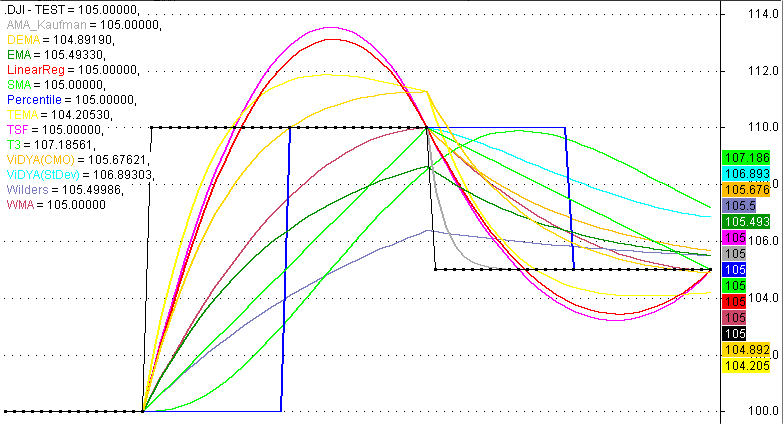
Compare of moving averages (www.amisite.ru) for Amibroker (AFL)
Andrew777k about 16 years ago Amibroker (AFL)
DEMA
EMA
Linear Regression
SMA
Percentile
TEMA
TSF
T3
ViDYA(CMO)
ViDYA(StDev)
Wilders
WMA
Screenshots
Indicator / Formula
Copy & Paste Friendly
per=Param("Period", 20, 5, 50, 1);
L1=LastValue(Cum(1));
C1=IIf(Cum(1)>L1-2*per AND Cum(1)<=L1-per,110,IIf(Cum(1)<=L1-2*PER,100,105));
Plot(C1,"TEST",1,8);

m10 = ParamToggle("AMA Kaufman", "Hide|Show");
C10 = ParamColor( "AMA_Kaufman Color" , colorCycle );
if (m10)
{
   P = C1;
   fast = 2/(2+1);
   slow = 2/(30+1 );
   dir=abs(p-Ref(p,-Per));
   vol=Sum(abs(p-Ref(p,-1)),Per);
   ER=dir/vol;
   sc =( ER*(fast-slow)+slow)^2;
   Plot( AMA(P, SC), "\n AMA_Kaufman", C10, ParamStyle("Style" ));
}

m11 = ParamToggle("DEMA", "Hide|Show" );
C11 = ParamColor( "DEMA Color", colorCycle );
if (m11)
{
   P = C1;
   Plot( DEMA( P, per ), "\n DEMA", C11, ParamStyle("Style" ) );
}

m12 = ParamToggle("EMA", "Hide|Show" );
C12 = ParamColor( "EMA Color", colorCycle);
if (m12)
{
   P = C1;
   Plot( EMA( P, per ), "\n EMA", ParamColor( "EMA Color", colorCycle), ParamStyle("Style" ) );
}

m13 = ParamToggle("Linear Regression", "Hide|Show" );
C13 = ParamColor( "LinearReg Color", colorCycle );
if (m13)
{
   P = C1;
   Plot( LinearReg( P, Per ), "\n LinearReg", C13, ParamStyle("Style") );
}

m14 = ParamToggle("SMA", "Hide|Show" );
C14 = ParamColor( "SMA Color", colorCycle);
if (m14)
{
   P = C1;
   Plot( MA( P, Per), "\n SMA", C14, ParamStyle("Style" ) );
}

m15 = ParamToggle("Percentile", "Hide|Show" );
C15 = ParamColor( "Percentile Color", colorCycle);
if (m15)
{
   P = C1;
   Rank = 50;
   Plot( Percentile(p, Per, rank), "\n Percentile", C15, ParamStyle("Style" ));
}

m16 = ParamToggle("TEMA", "Hide|Show" );
C16 = ParamColor( "TEMA Color", colorCycle);
if (m16)
{
   P = C1;
   Plot( TEMA( P, Per),"\n TEMA", C16, ParamStyle("Style" ) );
}

m17 = ParamToggle("TSF", "Hide|Show" );
C17 = ParamColor( "TSF Color", colorCycle);
if (m17)
{
   P = C1;
   Plot( TSF( P, Per), "\n TSF", C17, ParamStyle("Style" ) );
}

m18 = ParamToggle("T3", "Hide|Show" );
C18 = ParamColor( "T3 Color", colorCycle);
if (m18)
{
   P = C1;
   a = 0.7 ;
   e1=EMA (P,Per);
   e2=EMA (e1,Per);
   e3=EMA (e2,Per);
   e4=EMA (e3,Per);
   e5=EMA (e4,Per);
   e6=EMA (e5,Per);
   T3 = -a^3 * e6 + (3 * a^2 +3 * a^3) * e5 + (-6 * a^2 - 3 * a - 3 * a^3) * e4 + (1 + 3 * a + a^3 + 3 * a^2 ) * e3;
   Plot( T3, "\n T3", C18, ParamStyle("Style"));
}

m19 = ParamToggle("ViDYA(CMO)", "Hide|Show" );
C19 = ParamColor( "ViDYA(CMO) Color", colorCycle);
if (m19)
{
   P = C1;
   cmopds = per;
   n = per;
   f = 2/(n+1);
   Up = Sum(IIf(P > Ref(P, -1), (P - Ref(P ,-1)), 0 ), cmopds);
   Dw = Sum(IIf(P < Ref(P, -1), (Ref(P, -1) - P), 0 ), cmopds);
   CMO = abs ((Up - Dw)/(Up + Dw));
   sc = f*CMO;
   Plot( AMA(P, sc), "\n ViDYA(CMO)", C19, ParamStyle("Style" ));
}

m20 = ParamToggle("ViDYA(StDev)", "Hide|Show" );
C20 = ParamColor( "ViDYA(StDev) Color" , colorCycle);
if(m20)
{
   P = C1;
   n = per;
   f = 2/(n+1 );
   K = StDev(P, per)/StDev(P, 2*Per);
   sc = f*K;
   Plot( AMA(P, sc), "\n ViDYA(StDev)", C20, ParamStyle("Style"));
}

m21 = ParamToggle("Wilders", "Hide|Show" );
C21 = ParamColor( "Wilders Color", colorCycle);
if (m21)
{
   P = C1;
   Plot( Wilders( P, Per ), "\n Wilders", C21, ParamStyle("Style") );
}

m22 = ParamToggle("WMA", "Hide|Show" );
C22 = ParamColor( "WMA Color", colorCycle);
if (m22)
{
   P = C1;
   Plot( WMA( P, Per ), "\n WMA", C22, ParamStyle("Style") );
}
7 comments
Leave Comment
Please login here to leave a comment.
Hello,
Please explain to me what the indicators for this?
And how to apply it in our trading?
thanks
Please explain!
Dear administrator sir
There is a error problem PLZ help
Hello Kabir
Your version of Amibroker is probably too old. Try updating to a more recent version.
a blank chart appearing… may i know the version of ur amibroker
sorry yup can c it now.. thnx
This indicator is used to compare smoothness of different MA’s…Pls select show from parameter window to see the chart