N line break for Amibroker (AFL)
empottasch over 15 years ago Amibroker (AFL)
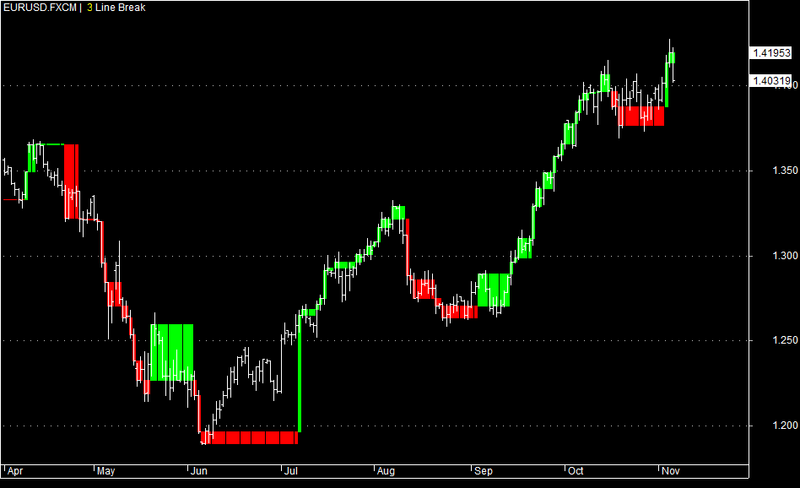
After Steve Nison’s book: Beyond Candlesticks, Chapter 6: three line break charts
Option 1: turn time axis on/off, Option 2: N-line break instead of 3-line break
Screenshots
Indicator / Formula
Copy & Paste Friendly
procedure constructChart_proc(nBar)
{
	global lBeginTime;
	global lEndTime;
	global lBeginNoTime;
	global lEndNoTime;
	global j;

	lBeginTime[ 0 ] = C[ 0 ];
	lEndTime[ 0 ] = C[ 0 ];
	lBeginNoTime[ 0 ] = C[ 0 ];
	lEndNoTime[ 0 ] = C[ 0 ];
	lastHigh = C[ 0 ];
	lastLow = C[ 0 ];
	numUp = 0;
	numDn = 0;
	j = 0;

	for ( i = 1; i < BarCount; i++ )
	{
		// 1) trend change up
		if ( C[ i ] > lastHigh AND numDn >= nBar AND numUp == 0)
		{
			numDn = 0;
			numUp = numUp + 1;
			j = j + 1;

			lBeginTime[ i ] = lBeginTime[ i - 1];
			lEndTime[ i ] = C[ i ];

			lBeginNoTime[ j ] = lBeginNoTime[ j - 1];
			lEndNoTime[ j ] = C[ i ];

			lastLow = lEndNoTime[ j - 1 ];
			lastHigh = C[ i ];
		}
		// 2) trend up continuation after downbar
		else if ( C[ i ] > lastHigh AND numDn > 0 AND numDn < nBar AND numUp == 0)
		{
			numDn = 0;
			numUp = numUp + 1;
			j = j + 1;

			lBeginTime[ i ] = lBeginTime[ i - 1];
			lEndTime[ i ] = C[ i ];

			lBeginNoTime[ j ] = lBeginNoTime[ j - 1];
			lEndNoTime[ j ] = C[ i ];

			lastLow = lEndNoTime[ j - 1 ];
			lastHigh = C[ i ];
		}
		// 3) trend up continuation
		else if ( C[ i ] > lastHigh AND numDn == 0 )
		{
			numDn = 0;
			numUp = numUp + 1;
			j = j + 1;

			lBeginTime[ i ] = lEndTime[ i - 1];
			lEndTime[ i ] = C[ i ];

			lBeginNoTime[ j ] = lEndNoTime[ j - 1];
			lEndNoTime[ j ] = C[ i ];

			if (numUp >= nbar)
			{
				lastLow = lEndNoTime[ j - nBar ];
			}
			else if (numUp < nBar)
			{
				lastLow = lastLow;
			}
			lastHigh = C[ i ];
		}
 		// 1) trend change down
		else if ( C[ i ] < lastLow AND numUp >= nBar AND numDn == 0)
		{
			numUp = 0;
			numDn = numDn + 1;
			j = j + 1;

			lBeginTime[ i ] = lBeginTime[ i - 1];
			lEndTime[ i ] = C[ i ];

			lBeginNoTime[ j ] = lBeginNoTime[ j - 1];
			lEndNoTime[ j ] = C[ i ];

			lastLow = C[ i ];
			lastHigh = lEndNoTime[ j - 1 ];
		}
		// 2) trend down continuation after upbar
		else if ( C[ i ] < lastLow AND numUp > 0 AND numUp < nBar AND numDn == 0)
		{
			numUp = 0;
			numDn = numDn + 1;
			j = j + 1;

			lBeginTime[ i ] = lBeginTime[ i - 1];
			lEndTime[ i ] = C[ i ];

			lBeginNoTime[ j ] = lBeginNoTime[ j - 1];
			lEndNoTime[ j ] = C[ i ];

			lastLow = C[ i ];
			lastHigh = lEndNoTime[ j - 1 ];
		}
		// 3) trend down continuation
		else if ( C[ i ] < lastLow AND numUp == 0 )
		{
			numUp = 0;
			numDn = numDn + 1;
			j = j + 1;

			lBeginTime[ i ] = lEndTime[ i - 1];
			lEndTime[ i ] = C[ i ];

			lBeginNoTime[ j ] = lEndNoTime[ j - 1];
			lEndNoTime[ j ] = C[ i ];

			if (numDn >= nbar)
			{
				lastHigh = lEndNoTime[ j - nBar ];
			}
			else if (numDn < nBar)
			{
				lastHigh = lastHigh;
			}
			lastLow = C[ i ];
		}
		// no break
		else if ( C[ i ] >= lastLow AND C[ i ] <= lastHigh )
		{
			lBeginTime[ i ] = lBeginTime[ i - 1];
			lEndTime[ i ] = lEndTime[ i - 1 ];
		}
	}
}

// code by E.M.Pottasch, 11/7/2010, N line Break Charts
// After Steve Nison's book: Beyond Candlesticks, Chapter 6: three line break charts
// Option 1: turn time axis on/off, Option 2: N-line break instead of 3-line break
SetBarsRequired( sbrAll, sbrAll );

nBar = Param( "nBar", 3, 2, 10, 1 );
constructChart_proc(nBar);

Title = Name() +
" |  " + EncodeColor( colorYellow ) + nbar + EncodeColor( colorWhite ) + " Line Break";

chartType = ParamToggle("Show Time Axis","show|hide",0);
if (chartType)
{
	GraphXSpace = 5;
	SetChartOptions( 0, chartShowDates );
	Plot(C, "\nTLB", colorWhite, styleBar);
	C = lEndTime;
	O = lBeginTime;
	H = IIf( C > O, C, O );
	L = IIf( C > O, O, C );
	Plot(C,"", colorWhite, styleCandle);
}
else
{
	delta = BarCount - 1 - j;
	lBeginNoTime = Ref(lBeginNoTime,-delta);
	lEndNoTime = Ref(lEndNoTime,-delta);
	C = lEndNoTime;
	O = lBeginNoTime;
	H = IIf( C > O, C, O );
	L = IIf( C > O, O, C );
	Plot(C,"\nTLB", colorWhite, styleCandle);
}
1 comments
Leave Comment
Please login here to leave a comment.
hi Empottasch sir, this afl looks very interesting, it would be helpful to all if you explain in detail about this afl.
thanks in advance,
Murali krishna